Zip Codes with the Highest Percentage of Immigrants from Eastern Asia in Springfield, OH
RELATED REPORTS & OPTIONS
Eastern Asia
Springfield
Compare Zip Codes
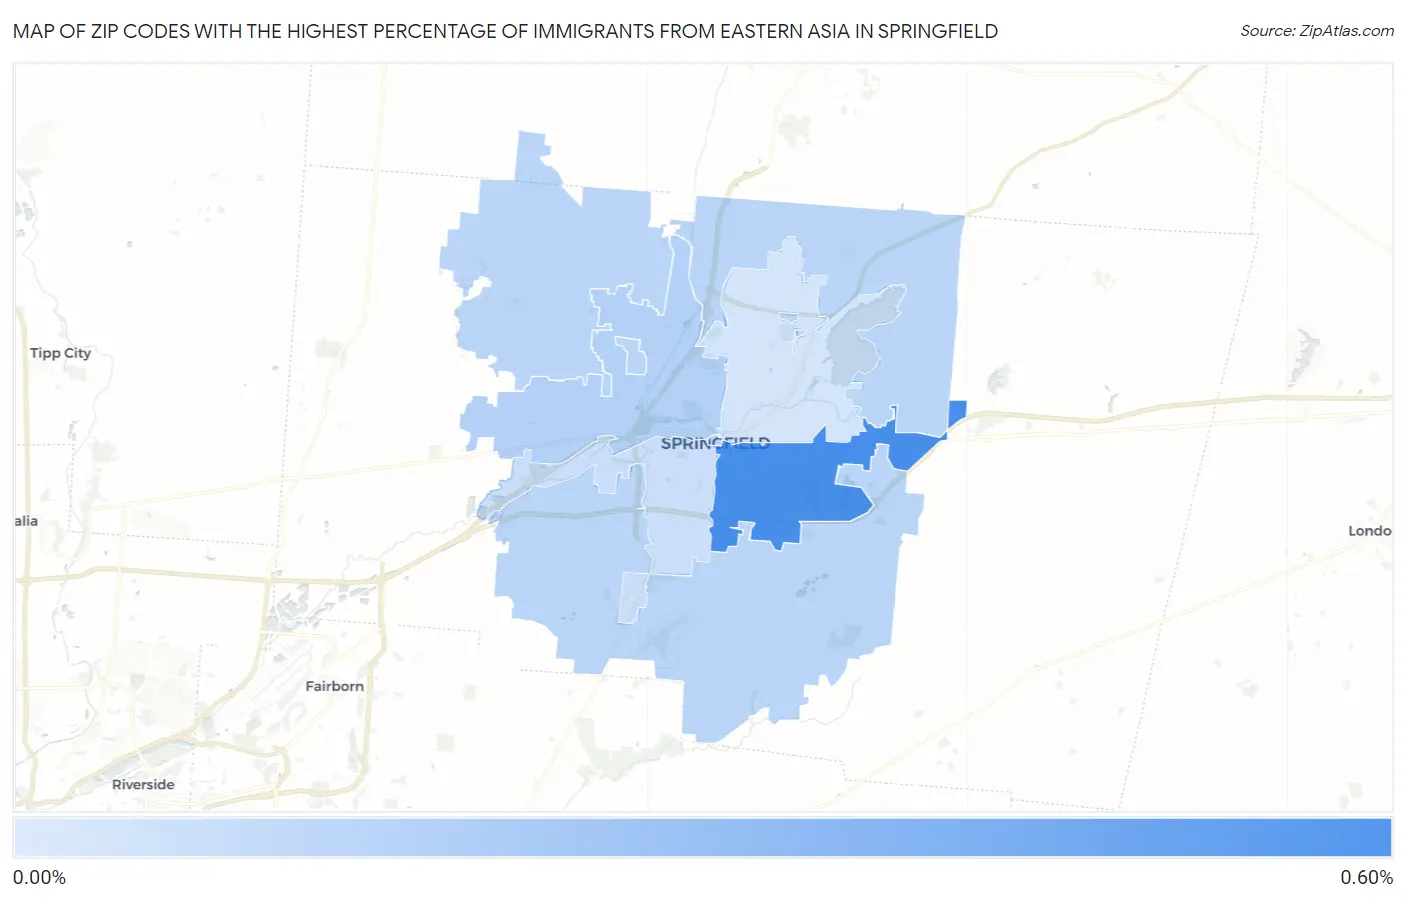
Map of Zip Codes with the Highest Percentage of Immigrants from Eastern Asia in Springfield
0.037%
0.55%
Zip Codes with the Highest Percentage of Immigrants from Eastern Asia in Springfield, OH
| Zip Code | Eastern Asia | vs State | vs National | |
| 1. | 45505 | 0.55% | 0.52%(+0.032)#152 | 1.28%(-0.724)#6,180 |
| 2. | 45504 | 0.15% | 0.52%(-0.370)#321 | 1.28%(-1.13)#11,214 |
| 3. | 45502 | 0.12% | 0.52%(-0.395)#343 | 1.28%(-1.15)#11,667 |
| 4. | 45506 | 0.068% | 0.52%(-0.451)#389 | 1.28%(-1.21)#12,859 |
| 5. | 45503 | 0.037% | 0.52%(-0.483)#423 | 1.28%(-1.24)#13,533 |
1
Common Questions
What are the Top 3 Zip Codes with the Highest Percentage of Immigrants from Eastern Asia in Springfield, OH?
Top 3 Zip Codes with the Highest Percentage of Immigrants from Eastern Asia in Springfield, OH are:
What zip code has the Highest Percentage of Immigrants from Eastern Asia in Springfield, OH?
45505 has the Highest Percentage of Immigrants from Eastern Asia in Springfield, OH with 0.55%.
What is the Percentage of Immigrants from Eastern Asia in Springfield, OH?
Percentage of Immigrants from Eastern Asia in Springfield is 0.23%.
What is the Percentage of Immigrants from Eastern Asia in Ohio?
Percentage of Immigrants from Eastern Asia in Ohio is 0.52%.
What is the Percentage of Immigrants from Eastern Asia in the United States?
Percentage of Immigrants from Eastern Asia in the United States is 1.28%.