Zip Codes with the Highest Percentage of Population Employed in Legal Services & Support in Springfield, OH
RELATED REPORTS & OPTIONS
Legal Services & Support
Springfield
Compare Zip Codes
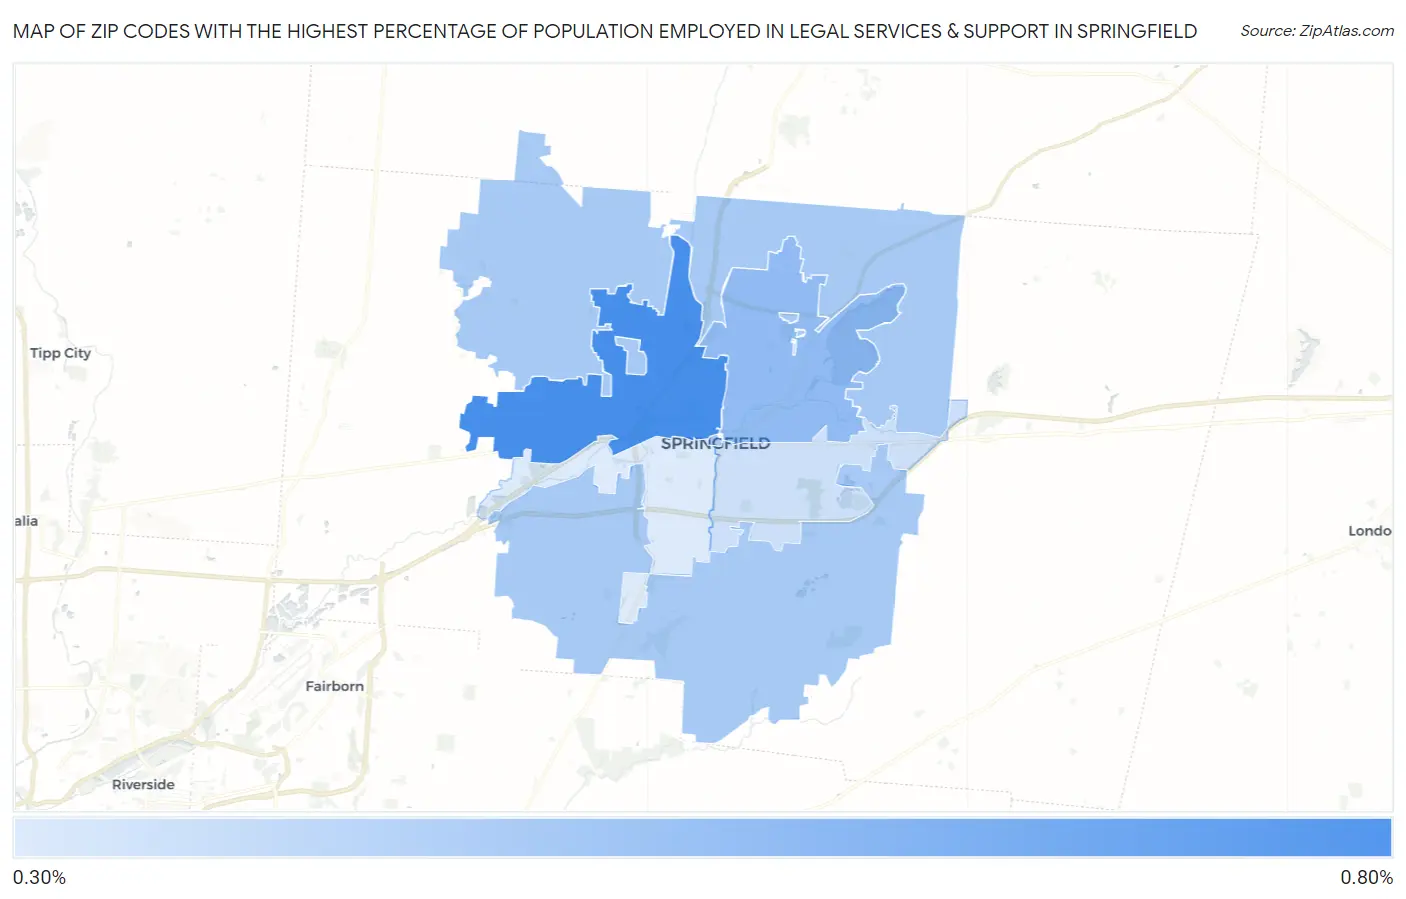
Map of Zip Codes with the Highest Percentage of Population Employed in Legal Services & Support in Springfield
0.38%
0.73%
Zip Codes with the Highest Percentage of Population Employed in Legal Services & Support in Springfield, OH
| Zip Code | % Employed | vs State | vs National | |
| 1. | 45504 | 0.73% | 0.92%(-0.196)#319 | 1.2%(-0.455)#10,113 |
| 2. | 45503 | 0.56% | 0.92%(-0.366)#390 | 1.2%(-0.625)#11,945 |
| 3. | 45502 | 0.50% | 0.92%(-0.423)#415 | 1.2%(-0.682)#12,602 |
| 4. | 45505 | 0.42% | 0.92%(-0.509)#461 | 1.2%(-0.767)#13,651 |
| 5. | 45506 | 0.38% | 0.92%(-0.546)#482 | 1.2%(-0.805)#14,094 |
1
Common Questions
What are the Top 3 Zip Codes with the Highest Percentage of Population Employed in Legal Services & Support in Springfield, OH?
Top 3 Zip Codes with the Highest Percentage of Population Employed in Legal Services & Support in Springfield, OH are:
What zip code has the Highest Percentage of Population Employed in Legal Services & Support in Springfield, OH?
45504 has the Highest Percentage of Population Employed in Legal Services & Support in Springfield, OH with 0.73%.
What is the Percentage of Population Employed in Legal Services & Support in Springfield, OH?
Percentage of Population Employed in Legal Services & Support in Springfield is 0.56%.
What is the Percentage of Population Employed in Legal Services & Support in Ohio?
Percentage of Population Employed in Legal Services & Support in Ohio is 0.92%.
What is the Percentage of Population Employed in Legal Services & Support in the United States?
Percentage of Population Employed in Legal Services & Support in the United States is 1.2%.