Zip Codes with the Highest Percentage of Households with Income Above $200,000 in Dayton, OH
RELATED REPORTS & OPTIONS
Household Income | $200k+
Dayton
Compare Zip Codes
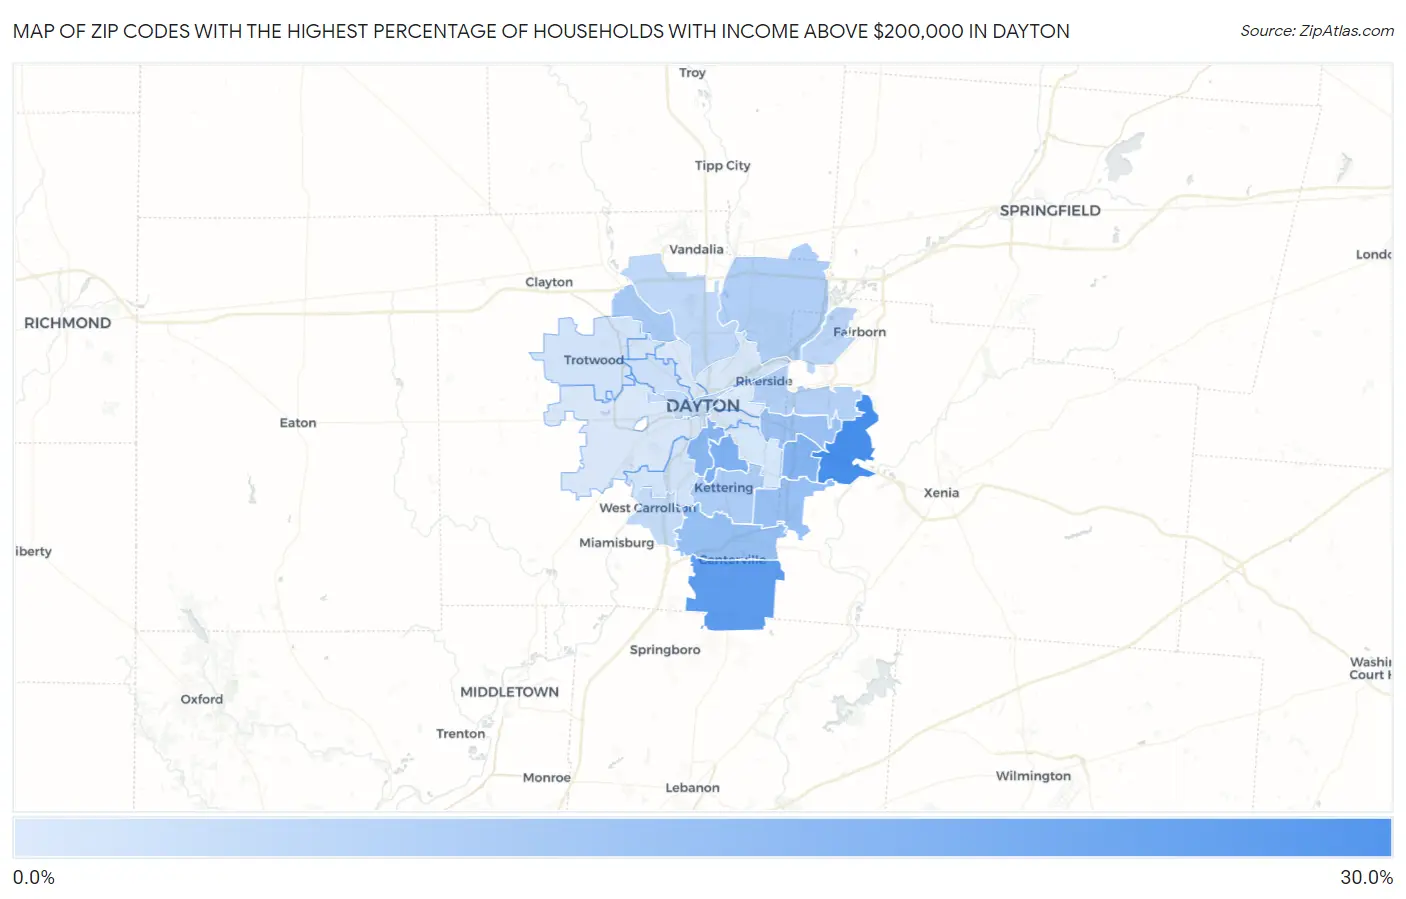
Map of Zip Codes with the Highest Percentage of Households with Income Above $200,000 in Dayton
0.30%
26.3%
Zip Codes with the Highest Percentage of Households with Income Above $200,000 in Dayton, OH
| Zip Code | Households with Income > $200k | vs State | vs National | |
| 1. | 45434 | 26.3% | 7.6%(+18.7)#31 | 11.4%(+14.9)#1,982 |
| 2. | 45458 | 21.8% | 7.6%(+14.2)#45 | 11.4%(+10.4)#2,816 |
| 3. | 45419 | 15.8% | 7.6%(+8.20)#79 | 11.4%(+4.40)#4,652 |
| 4. | 45430 | 15.1% | 7.6%(+7.50)#83 | 11.4%(+3.70)#4,949 |
| 5. | 45409 | 14.1% | 7.6%(+6.50)#99 | 11.4%(+2.70)#5,419 |
| 6. | 45459 | 12.1% | 7.6%(+4.50)#131 | 11.4%(+0.700)#6,597 |
| 7. | 45440 | 11.6% | 7.6%(+4.00)#140 | 11.4%(+0.200)#6,942 |
| 8. | 45432 | 10.9% | 7.6%(+3.30)#149 | 11.4%(-0.500)#7,491 |
| 9. | 45415 | 8.8% | 7.6%(+1.20)#224 | 11.4%(-2.60)#9,444 |
| 10. | 45429 | 8.1% | 7.6%(+0.500)#250 | 11.4%(-3.30)#10,237 |
| 11. | 45424 | 7.2% | 7.6%(-0.400)#295 | 11.4%(-4.20)#11,469 |
| 12. | 45431 | 7.1% | 7.6%(-0.500)#299 | 11.4%(-4.30)#11,639 |
| 13. | 45433 | 5.4% | 7.6%(-2.20)#425 | 11.4%(-6.00)#14,803 |
| 14. | 45414 | 4.9% | 7.6%(-2.70)#469 | 11.4%(-6.50)#15,846 |
| 15. | 45449 | 4.4% | 7.6%(-3.20)#511 | 11.4%(-7.00)#17,046 |
| 16. | 45402 | 4.4% | 7.6%(-3.20)#513 | 11.4%(-7.00)#17,076 |
| 17. | 45406 | 2.8% | 7.6%(-4.80)#711 | 11.4%(-8.60)#21,449 |
| 18. | 45426 | 2.1% | 7.6%(-5.50)#810 | 11.4%(-9.30)#23,490 |
| 19. | 45439 | 2.0% | 7.6%(-5.60)#815 | 11.4%(-9.40)#23,778 |
| 20. | 45416 | 1.8% | 7.6%(-5.80)#838 | 11.4%(-9.60)#24,362 |
| 21. | 45420 | 1.4% | 7.6%(-6.20)#884 | 11.4%(-10.00)#25,298 |
| 22. | 45417 | 0.90% | 7.6%(-6.70)#945 | 11.4%(-10.5)#26,371 |
| 23. | 45410 | 0.90% | 7.6%(-6.70)#947 | 11.4%(-10.5)#26,380 |
| 24. | 45404 | 0.90% | 7.6%(-6.70)#950 | 11.4%(-10.5)#26,395 |
| 25. | 45405 | 0.50% | 7.6%(-7.10)#980 | 11.4%(-10.9)#27,084 |
| 26. | 45403 | 0.30% | 7.6%(-7.30)#992 | 11.4%(-11.1)#27,372 |
1
Common Questions
What are the Top 10 Zip Codes with the Highest Percentage of Households with Income Above $200,000 in Dayton, OH?
Top 10 Zip Codes with the Highest Percentage of Households with Income Above $200,000 in Dayton, OH are:
What zip code has the Highest Percentage of Households with Income Above $200,000 in Dayton, OH?
45434 has the Highest Percentage of Households with Income Above $200,000 in Dayton, OH with 26.3%.
What is the Percentage of Households with Income Above $200,000 in Dayton, OH?
Percentage of Households with Income Above $200,000 in Dayton is 2.4%.
What is the Percentage of Households with Income Above $200,000 in Ohio?
Percentage of Households with Income Above $200,000 in Ohio is 7.6%.
What is the Percentage of Households with Income Above $200,000 in the United States?
Percentage of Households with Income Above $200,000 in the United States is 11.4%.