Bethesda, OH Map & Demographics
Bethesda Map
Bethesda Overview
$24,243
PER CAPITA INCOME
$48,438
AVG FAMILY INCOME
$37,000
AVG HOUSEHOLD INCOME
0.4%
WAGE / INCOME GAP [ % ]
99.6¢/ $1
WAGE / INCOME GAP [ $ ]
0.46
INEQUALITY / GINI INDEX
1,237
TOTAL POPULATION
622
MALE POPULATION
615
FEMALE POPULATION
101.14
MALES / 100 FEMALES
98.87
FEMALES / 100 MALES
31.6
MEDIAN AGE
3.3
AVG FAMILY SIZE
2.4
AVG HOUSEHOLD SIZE
548
LABOR FORCE [ PEOPLE ]
53.9%
PERCENT IN LABOR FORCE
5.5%
UNEMPLOYMENT RATE
Bethesda Zip Codes
Bethesda Area Codes
Income in Bethesda
Income Overview in Bethesda
Per Capita Income in Bethesda is $24,243, while median incomes of families and households are $48,438 and $37,000 respectively.
| Characteristic | Number | Measure |
| Per Capita Income | 1,237 | $24,243 |
| Median Family Income | 279 | $48,438 |
| Mean Family Income | 279 | $74,124 |
| Median Household Income | 512 | $37,000 |
| Mean Household Income | 512 | $57,596 |
| Income Deficit | 279 | $0 |
| Wage / Income Gap (%) | 1,237 | 0.42% |
| Wage / Income Gap ($) | 1,237 | 99.58¢ per $1 |
| Gini / Inequality Index | 1,237 | 0.46 |
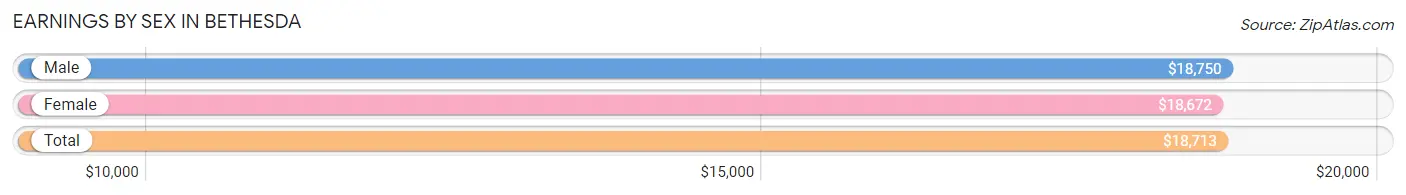
Earnings by Sex in Bethesda
Average Earnings in Bethesda are $18,713, $18,750 for men and $18,672 for women, a difference of 0.4%.
| Sex | Number | Average Earnings |
| Male | 330 (55.3%) | $18,750 |
| Female | 267 (44.7%) | $18,672 |
| Total | 597 (100.0%) | $18,713 |
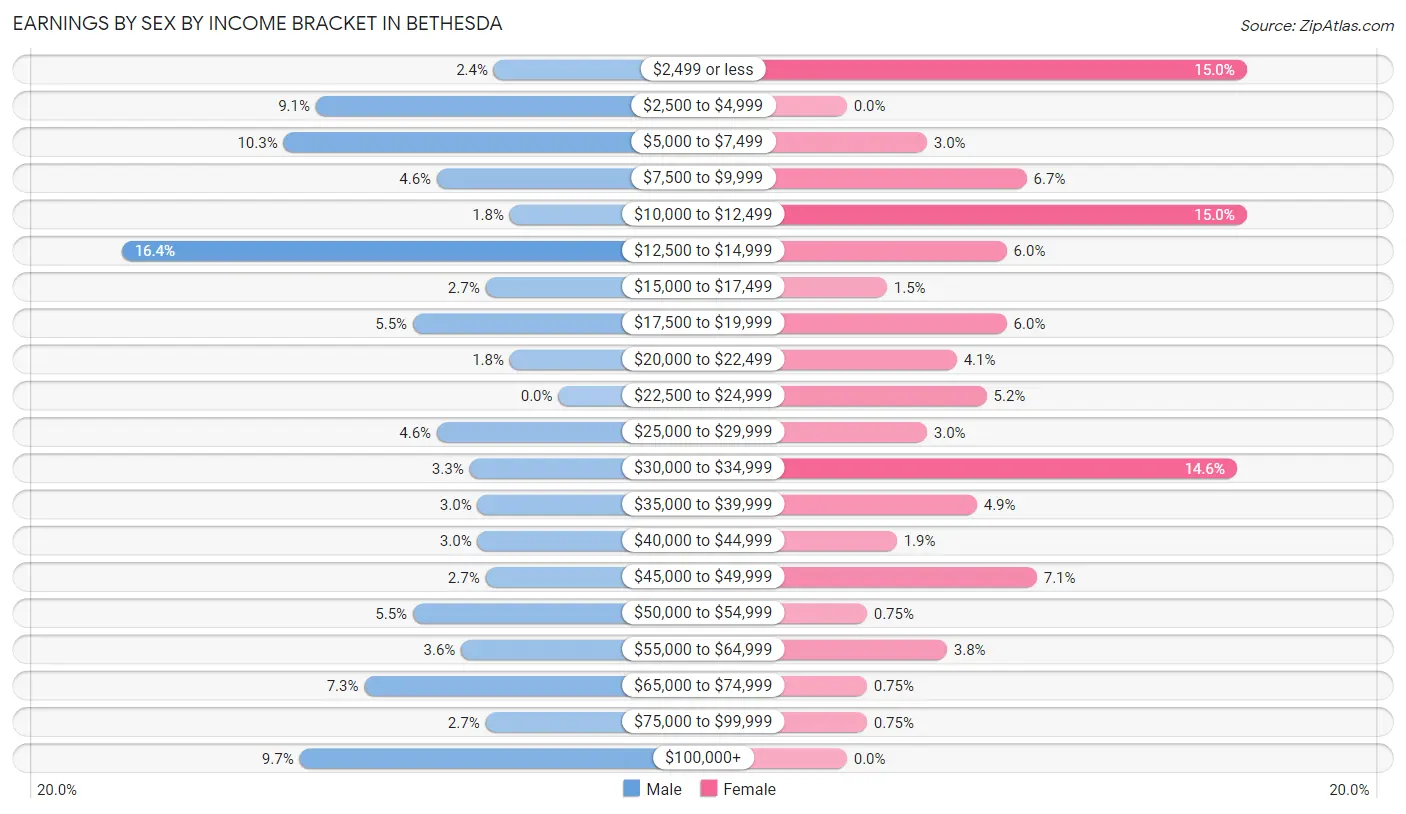
Earnings by Sex by Income Bracket in Bethesda
The most common earnings brackets in Bethesda are $12,500 to $14,999 for men (54 | 16.4%) and $2,499 or less for women (40 | 15.0%).
| Income | Male | Female |
| $2,499 or less | 8 (2.4%) | 40 (15.0%) |
| $2,500 to $4,999 | 30 (9.1%) | 0 (0.0%) |
| $5,000 to $7,499 | 34 (10.3%) | 8 (3.0%) |
| $7,500 to $9,999 | 15 (4.5%) | 18 (6.7%) |
| $10,000 to $12,499 | 6 (1.8%) | 40 (15.0%) |
| $12,500 to $14,999 | 54 (16.4%) | 16 (6.0%) |
| $15,000 to $17,499 | 9 (2.7%) | 4 (1.5%) |
| $17,500 to $19,999 | 18 (5.4%) | 16 (6.0%) |
| $20,000 to $22,499 | 6 (1.8%) | 11 (4.1%) |
| $22,500 to $24,999 | 0 (0.0%) | 14 (5.2%) |
| $25,000 to $29,999 | 15 (4.5%) | 8 (3.0%) |
| $30,000 to $34,999 | 11 (3.3%) | 39 (14.6%) |
| $35,000 to $39,999 | 10 (3.0%) | 13 (4.9%) |
| $40,000 to $44,999 | 10 (3.0%) | 5 (1.9%) |
| $45,000 to $49,999 | 9 (2.7%) | 19 (7.1%) |
| $50,000 to $54,999 | 18 (5.4%) | 2 (0.7%) |
| $55,000 to $64,999 | 12 (3.6%) | 10 (3.7%) |
| $65,000 to $74,999 | 24 (7.3%) | 2 (0.7%) |
| $75,000 to $99,999 | 9 (2.7%) | 2 (0.7%) |
| $100,000+ | 32 (9.7%) | 0 (0.0%) |
| Total | 330 (100.0%) | 267 (100.0%) |
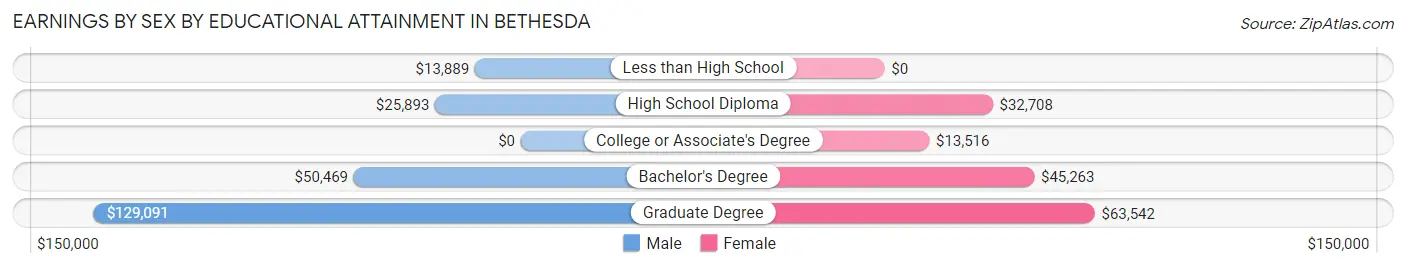
Earnings by Sex by Educational Attainment in Bethesda
Average earnings in Bethesda are $28,000 for men and $21,023 for women, a difference of 24.9%. Men with an educational attainment of graduate degree enjoy the highest average annual earnings of $129,091, while those with less than high school education earn the least with $13,889. Women with an educational attainment of graduate degree earn the most with the average annual earnings of $63,542, while those with college or associate's degree education have the smallest earnings of $13,516.
| Educational Attainment | Male Income | Female Income |
| Less than High School | $13,889 | $0 |
| High School Diploma | $25,893 | $32,708 |
| College or Associate's Degree | - | - |
| Bachelor's Degree | $50,469 | $45,263 |
| Graduate Degree | $129,091 | $63,542 |
| Total | $28,000 | $21,023 |
Family Income in Bethesda
Family Income Brackets in Bethesda
According to the Bethesda family income data, there are 57 families falling into the $35,000 to $49,999 income range, which is the most common income bracket and makes up 20.4% of all families. Conversely, the $150,000 to $199,999 income bracket is the least frequent group with only 5 families (1.8%) belonging to this category.
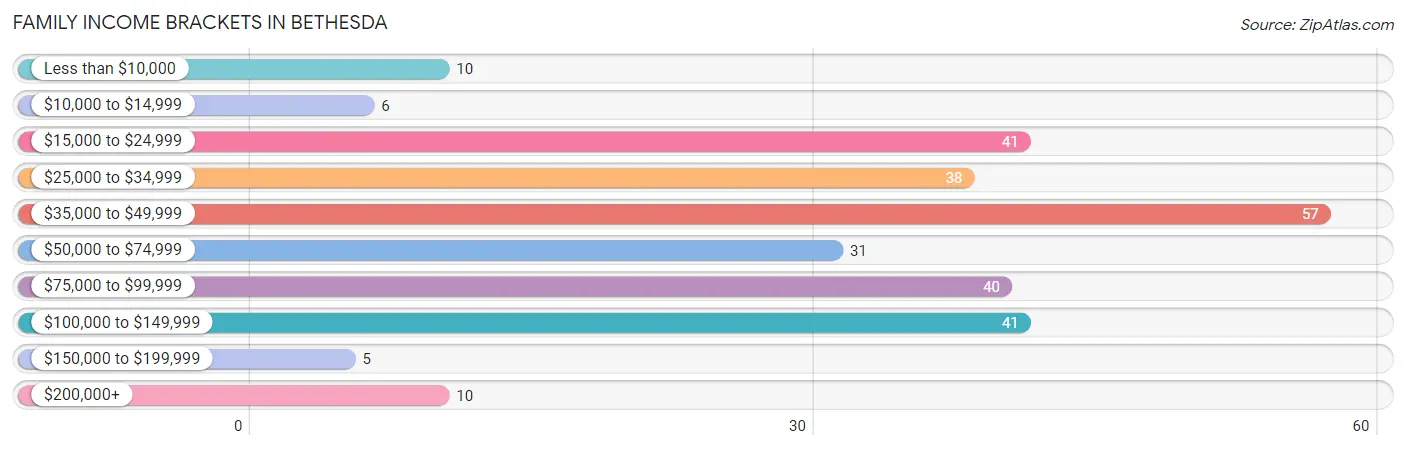
| Income Bracket | # Families | % Families |
| Less than $10,000 | 10 | 3.6% |
| $10,000 to $14,999 | 6 | 2.2% |
| $15,000 to $24,999 | 41 | 14.7% |
| $25,000 to $34,999 | 38 | 13.6% |
| $35,000 to $49,999 | 57 | 20.4% |
| $50,000 to $74,999 | 31 | 11.1% |
| $75,000 to $99,999 | 40 | 14.3% |
| $100,000 to $149,999 | 41 | 14.7% |
| $150,000 to $199,999 | 5 | 1.8% |
| $200,000+ | 10 | 3.6% |
Family Income by Famaliy Size in Bethesda
5-person families (20 | 7.2%) account for the highest median family income in Bethesda with $85,000 per family, while 2-person families (136 | 48.7%) have the highest median income of $26,607 per family member.
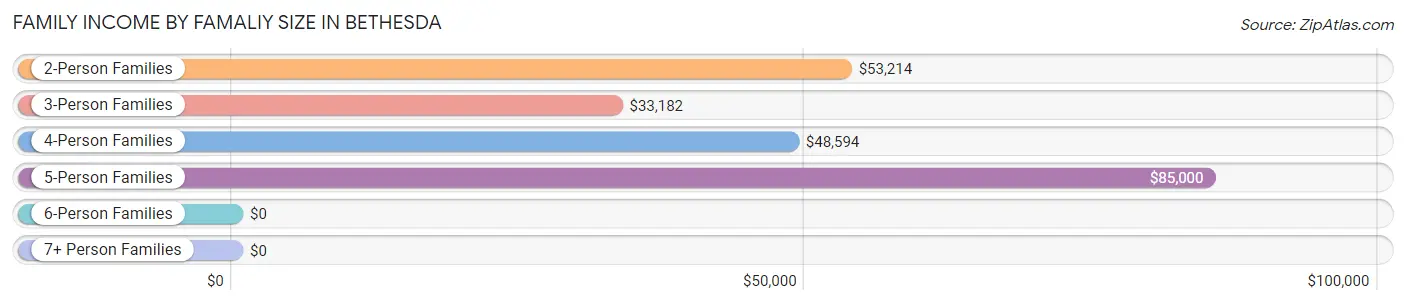
| Income Bracket | # Families | Median Income |
| 2-Person Families | 136 (48.7%) | $53,214 |
| 3-Person Families | 60 (21.5%) | $33,182 |
| 4-Person Families | 46 (16.5%) | $48,594 |
| 5-Person Families | 20 (7.2%) | $85,000 |
| 6-Person Families | 17 (6.1%) | $0 |
| 7+ Person Families | 0 (0.0%) | $0 |
| Total | 279 (100.0%) | $48,438 |
Family Income by Number of Earners in Bethesda
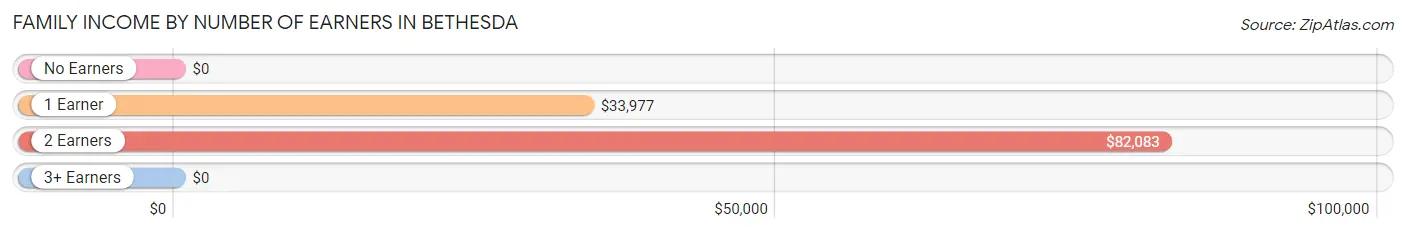
| Number of Earners | # Families | Median Income |
| No Earners | 68 (24.4%) | $0 |
| 1 Earner | 93 (33.3%) | $33,977 |
| 2 Earners | 101 (36.2%) | $82,083 |
| 3+ Earners | 17 (6.1%) | $0 |
| Total | 279 (100.0%) | $48,438 |
Household Income in Bethesda
Household Income Brackets in Bethesda
With 114 households falling in the category, the $25,000 to $34,999 income range is the most frequent in Bethesda, accounting for 22.3% of all households. In contrast, only 5 households (1.0%) fall into the $150,000 to $199,999 income bracket, making it the least populous group.
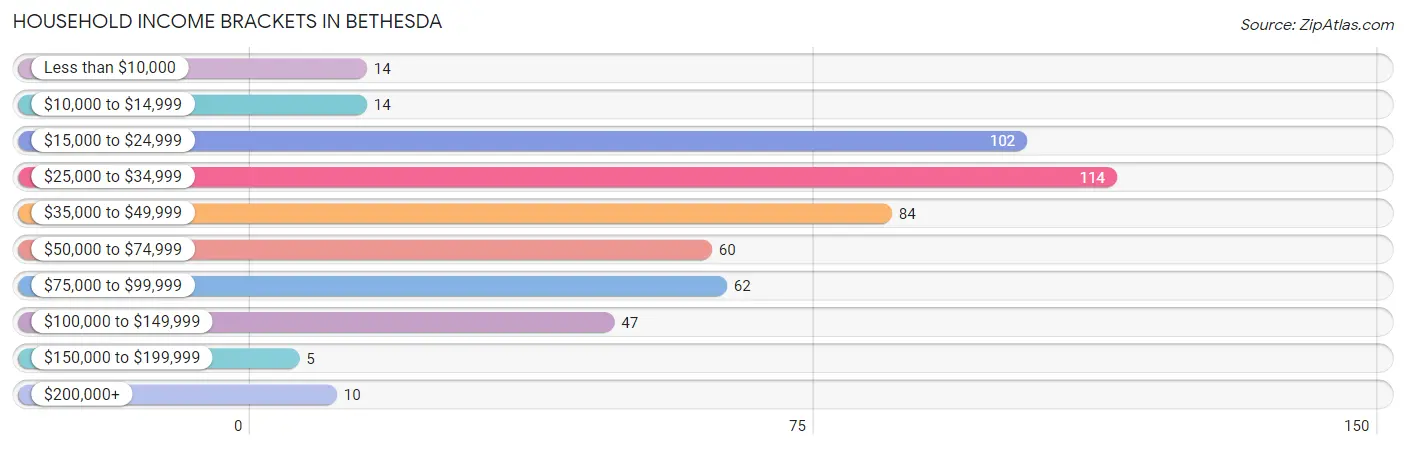
| Income Bracket | # Households | % Households |
| Less than $10,000 | 14 | 2.7% |
| $10,000 to $14,999 | 14 | 2.7% |
| $15,000 to $24,999 | 102 | 19.9% |
| $25,000 to $34,999 | 114 | 22.3% |
| $35,000 to $49,999 | 84 | 16.4% |
| $50,000 to $74,999 | 60 | 11.7% |
| $75,000 to $99,999 | 62 | 12.1% |
| $100,000 to $149,999 | 47 | 9.2% |
| $150,000 to $199,999 | 5 | 1.0% |
| $200,000+ | 10 | 2.0% |
Household Income by Householder Age in Bethesda
The median household income in Bethesda is $37,000, with the highest median household income of $52,500 found in the 45 to 64 years age bracket for the primary householder. A total of 122 households (23.8%) fall into this category. Meanwhile, the 15 to 24 years age bracket for the primary householder has the lowest median household income of $0, with 52 households (10.2%) in this group.
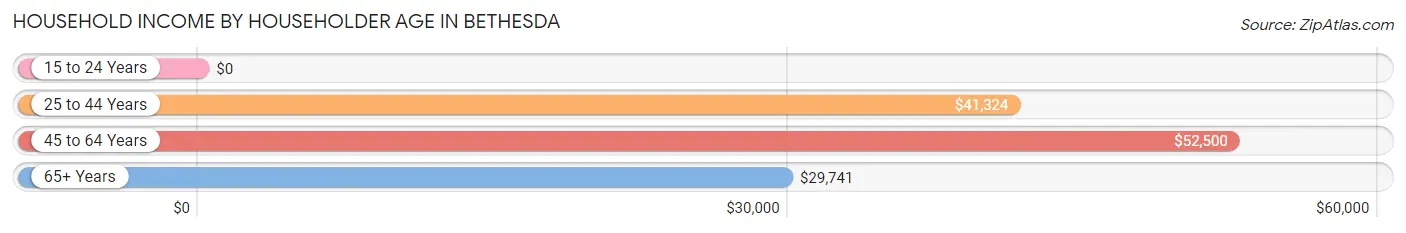
| Income Bracket | # Households | Median Income |
| 15 to 24 Years | 52 (10.2%) | $0 |
| 25 to 44 Years | 152 (29.7%) | $41,324 |
| 45 to 64 Years | 122 (23.8%) | $52,500 |
| 65+ Years | 186 (36.3%) | $29,741 |
| Total | 512 (100.0%) | $37,000 |
Poverty in Bethesda
Income Below Poverty by Sex and Age in Bethesda
With 19.0% poverty level for males and 15.3% for females among the residents of Bethesda, 16 and 17 year old males and 45 to 54 year old females are the most vulnerable to poverty, with 2 males (66.7%) and 15 females (48.4%) in their respective age groups living below the poverty level.
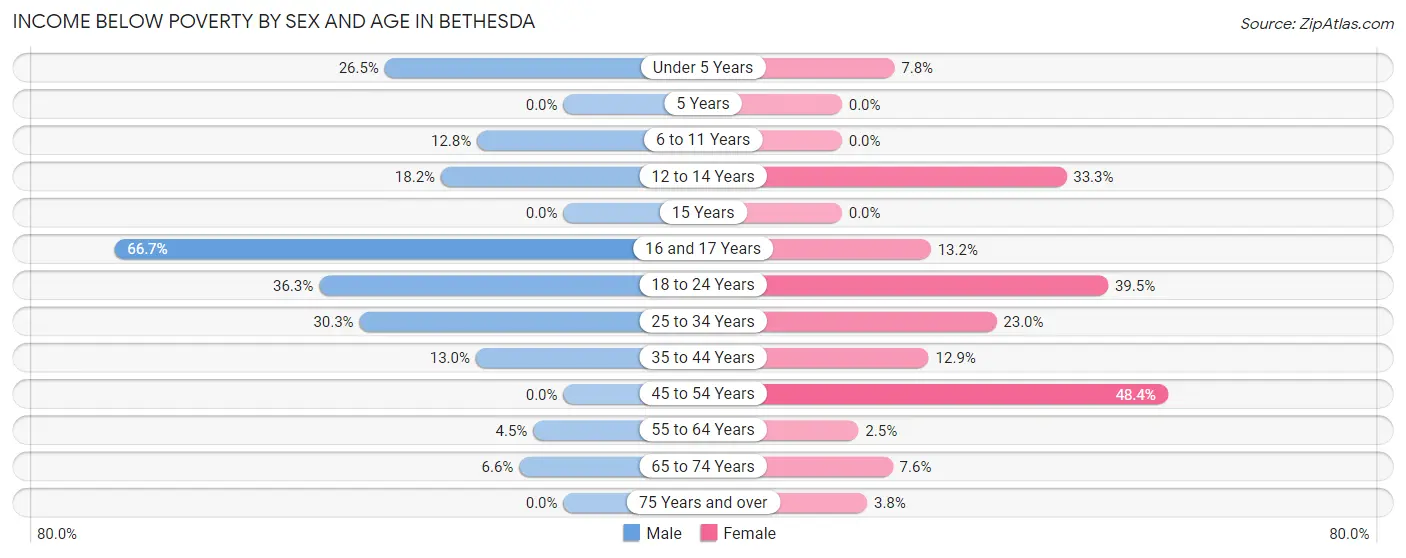
| Age Bracket | Male | Female |
| Under 5 Years | 13 (26.5%) | 5 (7.8%) |
| 5 Years | 0 (0.0%) | 0 (0.0%) |
| 6 to 11 Years | 5 (12.8%) | 0 (0.0%) |
| 12 to 14 Years | 4 (18.2%) | 2 (33.3%) |
| 15 Years | 0 (0.0%) | 0 (0.0%) |
| 16 and 17 Years | 2 (66.7%) | 7 (13.2%) |
| 18 to 24 Years | 41 (36.3%) | 34 (39.5%) |
| 25 to 34 Years | 33 (30.3%) | 14 (23.0%) |
| 35 to 44 Years | 13 (13.0%) | 8 (12.9%) |
| 45 to 54 Years | 0 (0.0%) | 15 (48.4%) |
| 55 to 64 Years | 3 (4.5%) | 2 (2.5%) |
| 65 to 74 Years | 4 (6.6%) | 4 (7.5%) |
| 75 Years and over | 0 (0.0%) | 3 (3.7%) |
| Total | 118 (19.0%) | 94 (15.3%) |
Income Above Poverty by Sex and Age in Bethesda
According to the poverty statistics in Bethesda, males aged 15 years and females aged 5 years are the age groups that are most secure financially, with 100.0% of males and 100.0% of females in these age groups living above the poverty line.
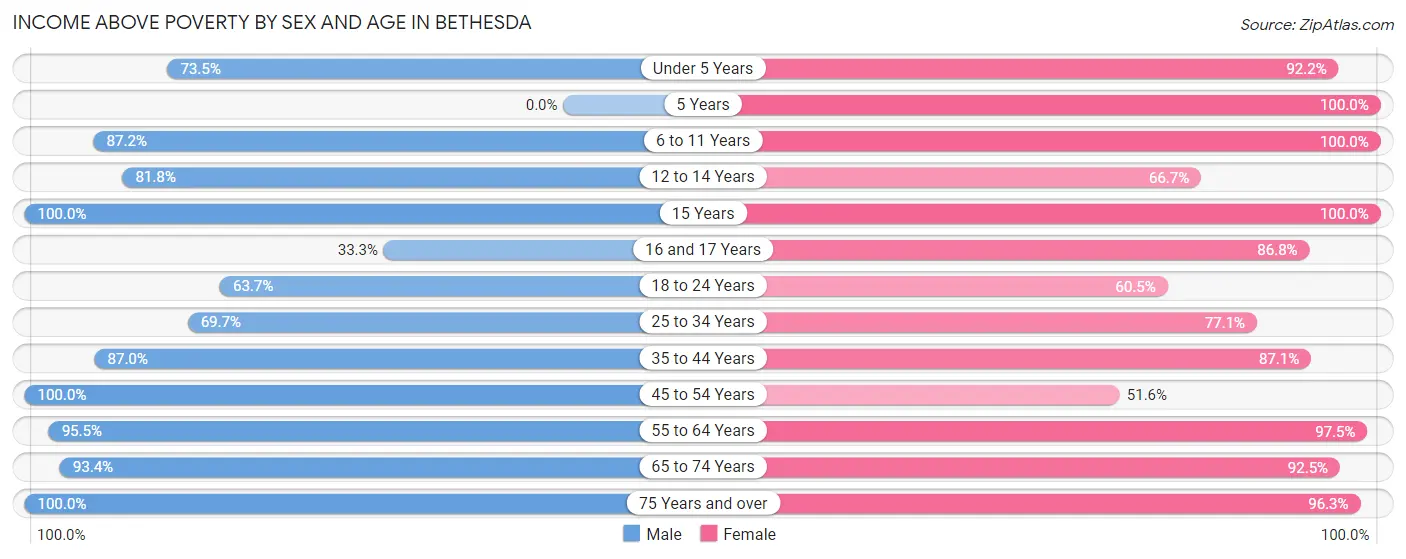
| Age Bracket | Male | Female |
| Under 5 Years | 36 (73.5%) | 59 (92.2%) |
| 5 Years | 0 (0.0%) | 21 (100.0%) |
| 6 to 11 Years | 34 (87.2%) | 12 (100.0%) |
| 12 to 14 Years | 18 (81.8%) | 4 (66.7%) |
| 15 Years | 3 (100.0%) | 5 (100.0%) |
| 16 and 17 Years | 1 (33.3%) | 46 (86.8%) |
| 18 to 24 Years | 72 (63.7%) | 52 (60.5%) |
| 25 to 34 Years | 76 (69.7%) | 47 (77.0%) |
| 35 to 44 Years | 87 (87.0%) | 54 (87.1%) |
| 45 to 54 Years | 28 (100.0%) | 16 (51.6%) |
| 55 to 64 Years | 64 (95.5%) | 79 (97.5%) |
| 65 to 74 Years | 57 (93.4%) | 49 (92.4%) |
| 75 Years and over | 28 (100.0%) | 77 (96.3%) |
| Total | 504 (81.0%) | 521 (84.7%) |
Income Below Poverty Among Married-Couple Families in Bethesda
The poverty statistics for married-couple families in Bethesda show that 4.6% or 7 of the total 153 families live below the poverty line. Families with 3 or 4 children have the highest poverty rate of 28.6%, comprising of 6 families. On the other hand, families with no children have the lowest poverty rate of 0.0%, which includes 0 families.
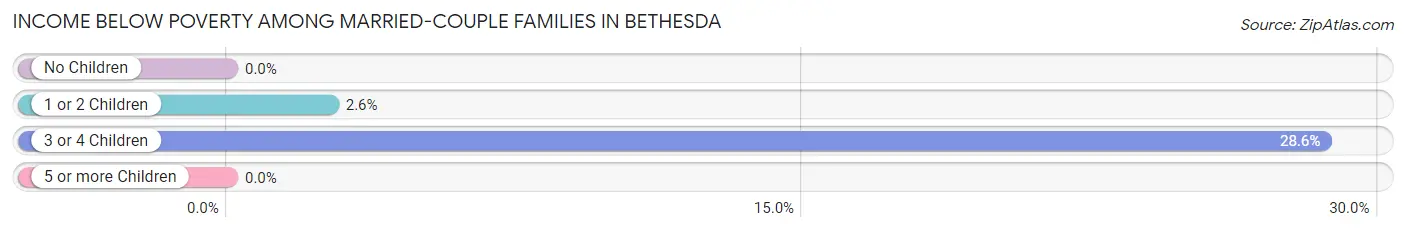
| Children | Above Poverty | Below Poverty |
| No Children | 94 (100.0%) | 0 (0.0%) |
| 1 or 2 Children | 37 (97.4%) | 1 (2.6%) |
| 3 or 4 Children | 15 (71.4%) | 6 (28.6%) |
| 5 or more Children | 0 (0.0%) | 0 (0.0%) |
| Total | 146 (95.4%) | 7 (4.6%) |
Income Below Poverty Among Single-Parent Households in Bethesda
According to the poverty data in Bethesda, 10.0% or 4 single-father households and 22.1% or 19 single-mother households are living below the poverty line. Among single-father households, those with no children have the highest poverty rate, with 4 households (11.8%) experiencing poverty. Likewise, among single-mother households, those with no children have the highest poverty rate, with 6 households (60.0%) falling below the poverty line.
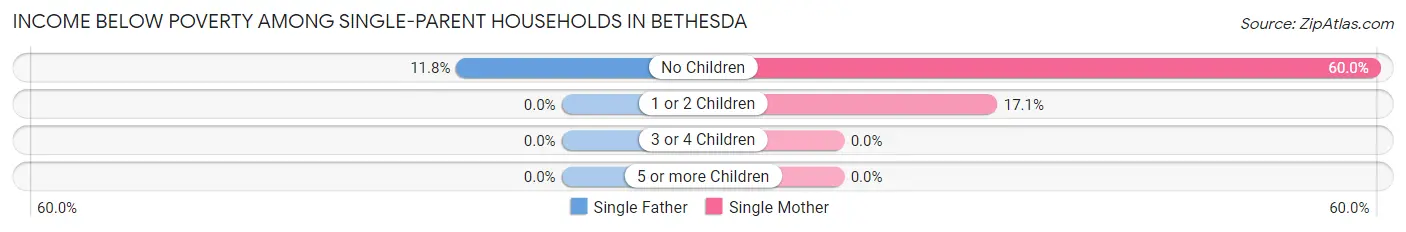
| Children | Single Father | Single Mother |
| No Children | 4 (11.8%) | 6 (60.0%) |
| 1 or 2 Children | 0 (0.0%) | 13 (17.1%) |
| 3 or 4 Children | 0 (0.0%) | 0 (0.0%) |
| 5 or more Children | 0 (0.0%) | 0 (0.0%) |
| Total | 4 (10.0%) | 19 (22.1%) |
Income Below Poverty Among Married-Couple vs Single-Parent Households in Bethesda
The poverty data for Bethesda shows that 7 of the married-couple family households (4.6%) and 23 of the single-parent households (18.2%) are living below the poverty level. Within the married-couple family households, those with 3 or 4 children have the highest poverty rate, with 6 households (28.6%) falling below the poverty line. Among the single-parent households, those with no children have the highest poverty rate, with 10 household (22.7%) living below poverty.
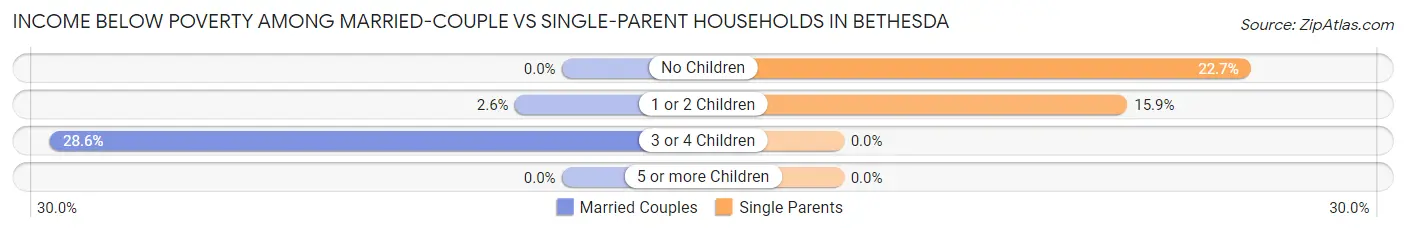
| Children | Married-Couple Families | Single-Parent Households |
| No Children | 0 (0.0%) | 10 (22.7%) |
| 1 or 2 Children | 1 (2.6%) | 13 (15.9%) |
| 3 or 4 Children | 6 (28.6%) | 0 (0.0%) |
| 5 or more Children | 0 (0.0%) | 0 (0.0%) |
| Total | 7 (4.6%) | 23 (18.2%) |
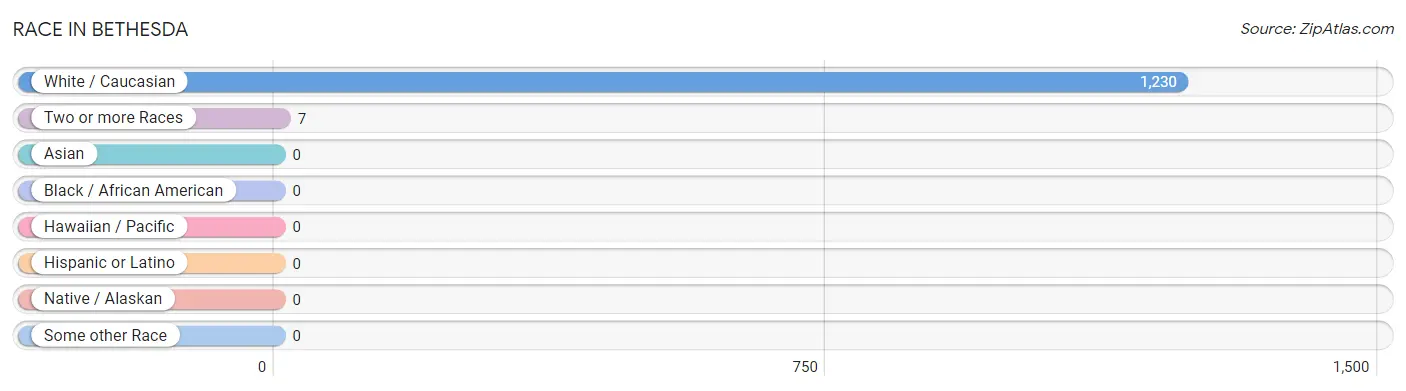
Race in Bethesda
The most populous races in Bethesda are White / Caucasian (1,230 | 99.4%), and Two or more Races (7 | 0.6%).
| Race | # Population | % Population |
| Asian | 0 | 0.0% |
| Black / African American | 0 | 0.0% |
| Hawaiian / Pacific | 0 | 0.0% |
| Hispanic or Latino | 0 | 0.0% |
| Native / Alaskan | 0 | 0.0% |
| White / Caucasian | 1,230 | 99.4% |
| Two or more Races | 7 | 0.6% |
| Some other Race | 0 | 0.0% |
| Total | 1,237 | 100.0% |
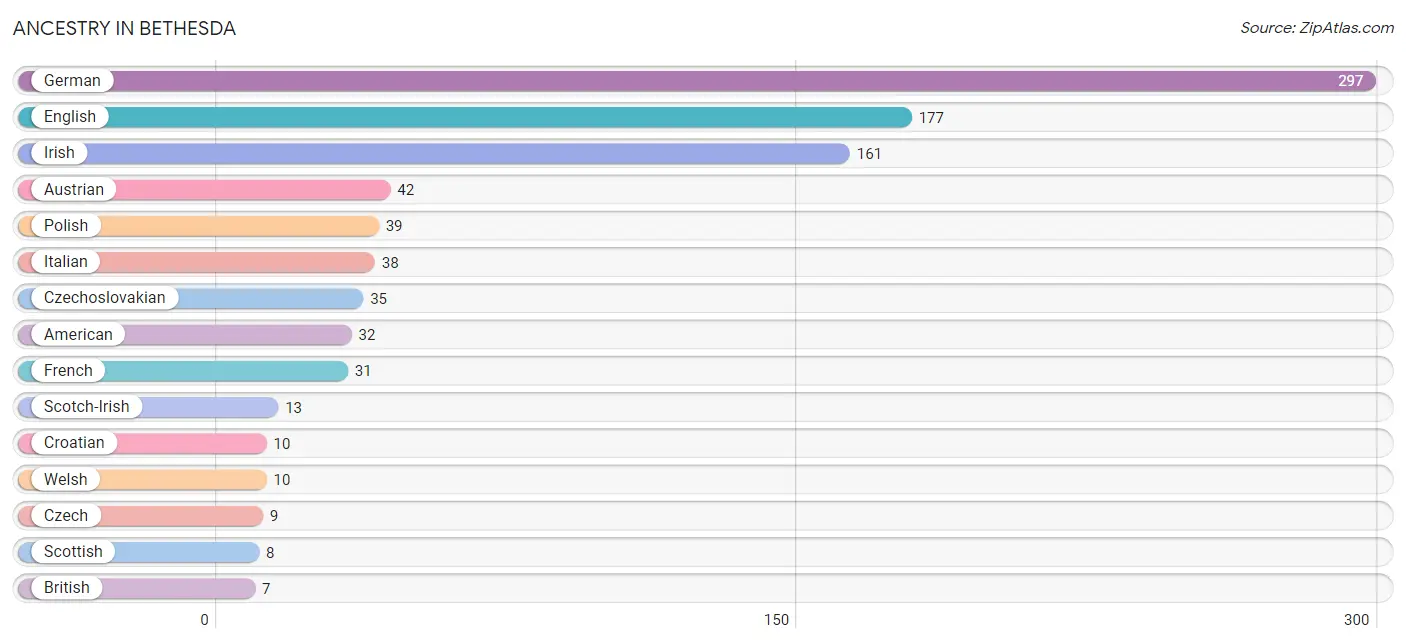
Ancestry in Bethesda
The most populous ancestries reported in Bethesda are German (297 | 24.0%), English (177 | 14.3%), Irish (161 | 13.0%), Austrian (42 | 3.4%), and Polish (39 | 3.2%), together accounting for 57.9% of all Bethesda residents.
| Ancestry | # Population | % Population |
| American | 32 | 2.6% |
| Austrian | 42 | 3.4% |
| British | 7 | 0.6% |
| Cherokee | 2 | 0.2% |
| Croatian | 10 | 0.8% |
| Czech | 9 | 0.7% |
| Czechoslovakian | 35 | 2.8% |
| Danish | 4 | 0.3% |
| Dutch | 6 | 0.5% |
| English | 177 | 14.3% |
| European | 2 | 0.2% |
| French | 31 | 2.5% |
| German | 297 | 24.0% |
| Greek | 7 | 0.6% |
| Hungarian | 6 | 0.5% |
| Irish | 161 | 13.0% |
| Italian | 38 | 3.1% |
| Polish | 39 | 3.2% |
| Scotch-Irish | 13 | 1.1% |
| Scottish | 8 | 0.6% |
| Welsh | 10 | 0.8% | View All 21 Rows |
Immigrants in Bethesda
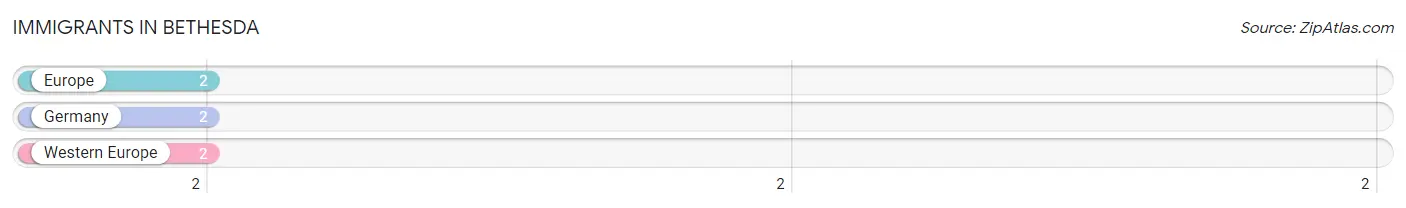
The most numerous immigrant groups reported in Bethesda came from Europe (2 | 0.2%), Germany (2 | 0.2%), and Western Europe (2 | 0.2%), together accounting for 0.5% of all Bethesda residents.
| Immigration Origin | # Population | % Population |
| Europe | 2 | 0.2% |
| Germany | 2 | 0.2% |
| Western Europe | 2 | 0.2% | View All 3 Rows |
Sex and Age in Bethesda
Sex and Age in Bethesda
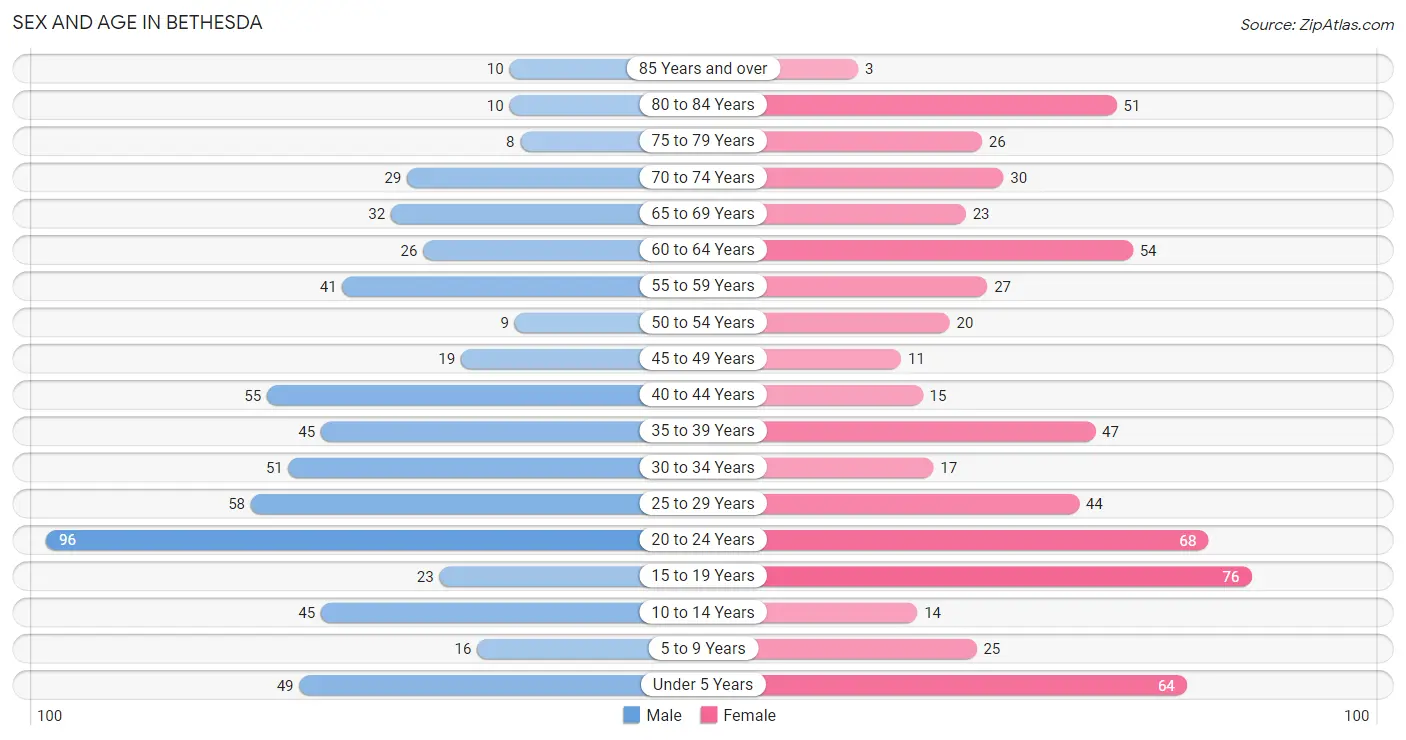
The most populous age groups in Bethesda are 20 to 24 Years (96 | 15.4%) for men and 15 to 19 Years (76 | 12.4%) for women.
| Age Bracket | Male | Female |
| Under 5 Years | 49 (7.9%) | 64 (10.4%) |
| 5 to 9 Years | 16 (2.6%) | 25 (4.1%) |
| 10 to 14 Years | 45 (7.2%) | 14 (2.3%) |
| 15 to 19 Years | 23 (3.7%) | 76 (12.4%) |
| 20 to 24 Years | 96 (15.4%) | 68 (11.1%) |
| 25 to 29 Years | 58 (9.3%) | 44 (7.1%) |
| 30 to 34 Years | 51 (8.2%) | 17 (2.8%) |
| 35 to 39 Years | 45 (7.2%) | 47 (7.6%) |
| 40 to 44 Years | 55 (8.8%) | 15 (2.4%) |
| 45 to 49 Years | 19 (3.0%) | 11 (1.8%) |
| 50 to 54 Years | 9 (1.5%) | 20 (3.3%) |
| 55 to 59 Years | 41 (6.6%) | 27 (4.4%) |
| 60 to 64 Years | 26 (4.2%) | 54 (8.8%) |
| 65 to 69 Years | 32 (5.1%) | 23 (3.7%) |
| 70 to 74 Years | 29 (4.7%) | 30 (4.9%) |
| 75 to 79 Years | 8 (1.3%) | 26 (4.2%) |
| 80 to 84 Years | 10 (1.6%) | 51 (8.3%) |
| 85 Years and over | 10 (1.6%) | 3 (0.5%) |
| Total | 622 (100.0%) | 615 (100.0%) |
Families and Households in Bethesda
Median Family Size in Bethesda
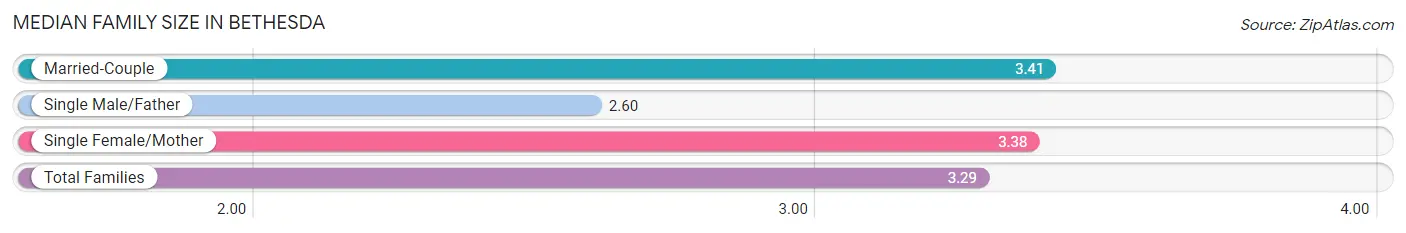
The median family size in Bethesda is 3.29 persons per family, with married-couple families (153 | 54.8%) accounting for the largest median family size of 3.41 persons per family. On the other hand, single male/father families (40 | 14.3%) represent the smallest median family size with 2.60 persons per family.
| Family Type | # Families | Family Size |
| Married-Couple | 153 (54.8%) | 3.41 |
| Single Male/Father | 40 (14.3%) | 2.60 |
| Single Female/Mother | 86 (30.8%) | 3.38 |
| Total Families | 279 (100.0%) | 3.29 |
Median Household Size in Bethesda
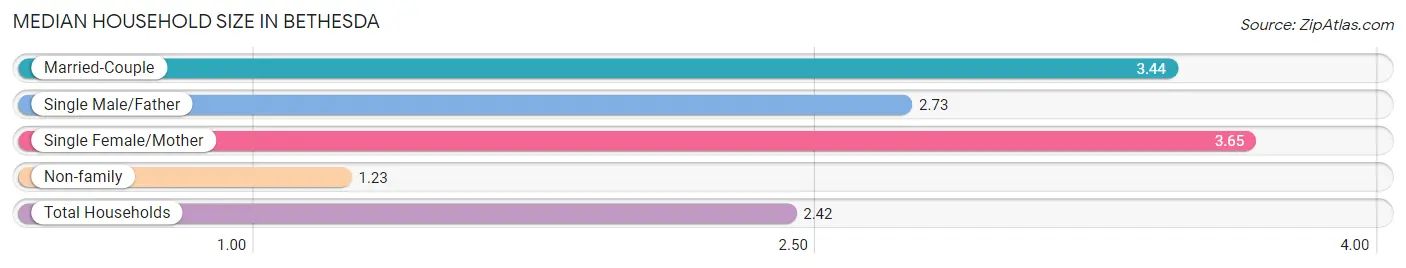
The median household size in Bethesda is 2.42 persons per household, with single female/mother households (86 | 16.8%) accounting for the largest median household size of 3.65 persons per household. non-family households (233 | 45.5%) represent the smallest median household size with 1.23 persons per household.
| Household Type | # Households | Household Size |
| Married-Couple | 153 (29.9%) | 3.44 |
| Single Male/Father | 40 (7.8%) | 2.73 |
| Single Female/Mother | 86 (16.8%) | 3.65 |
| Non-family | 233 (45.5%) | 1.23 |
| Total Households | 512 (100.0%) | 2.42 |
Household Size by Marriage Status in Bethesda
Out of a total of 512 households in Bethesda, 279 (54.5%) are family households, while 233 (45.5%) are nonfamily households. The most numerous type of family households are 2-person households, comprising 121, and the most common type of nonfamily households are 1-person households, comprising 186.
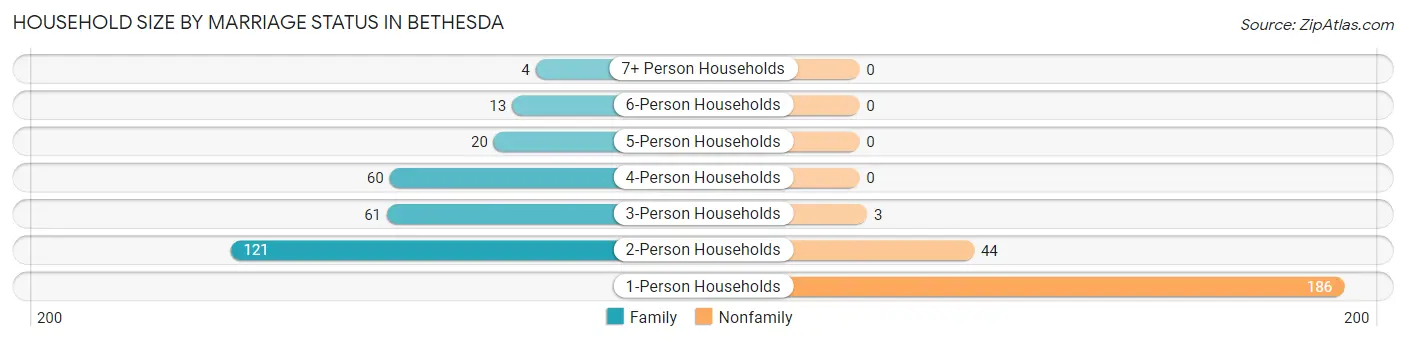
| Household Size | Family Households | Nonfamily Households |
| 1-Person Households | - | 186 (36.3%) |
| 2-Person Households | 121 (23.6%) | 44 (8.6%) |
| 3-Person Households | 61 (11.9%) | 3 (0.6%) |
| 4-Person Households | 60 (11.7%) | 0 (0.0%) |
| 5-Person Households | 20 (3.9%) | 0 (0.0%) |
| 6-Person Households | 13 (2.5%) | 0 (0.0%) |
| 7+ Person Households | 4 (0.8%) | 0 (0.0%) |
| Total | 279 (54.5%) | 233 (45.5%) |
Female Fertility in Bethesda
Fertility by Age in Bethesda
Average fertility rate in Bethesda is 14.0 births per 1,000 women. Women in the age bracket of 20 to 34 years have the highest fertility rate with 31.0 births per 1,000 women. Women in the age bracket of 20 to 34 years acount for 100.0% of all women with births.
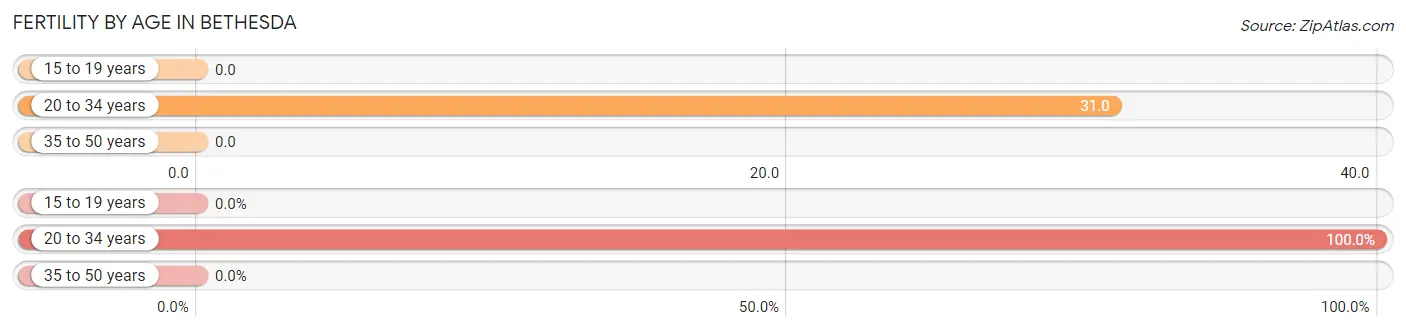
| Age Bracket | Women with Births | Births / 1,000 Women |
| 15 to 19 years | 0 (0.0%) | 0.0 |
| 20 to 34 years | 4 (100.0%) | 31.0 |
| 35 to 50 years | 0 (0.0%) | 0.0 |
| Total | 4 (100.0%) | 14.0 |
Fertility by Age by Marriage Status in Bethesda
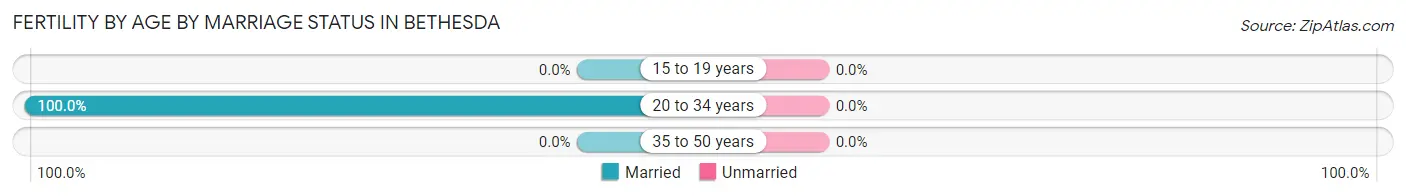
| Age Bracket | Married | Unmarried |
| 15 to 19 years | 0 (0.0%) | 0 (0.0%) |
| 20 to 34 years | 4 (100.0%) | 0 (0.0%) |
| 35 to 50 years | 0 (0.0%) | 0 (0.0%) |
| Total | 4 (100.0%) | 0 (0.0%) |
Fertility by Education in Bethesda
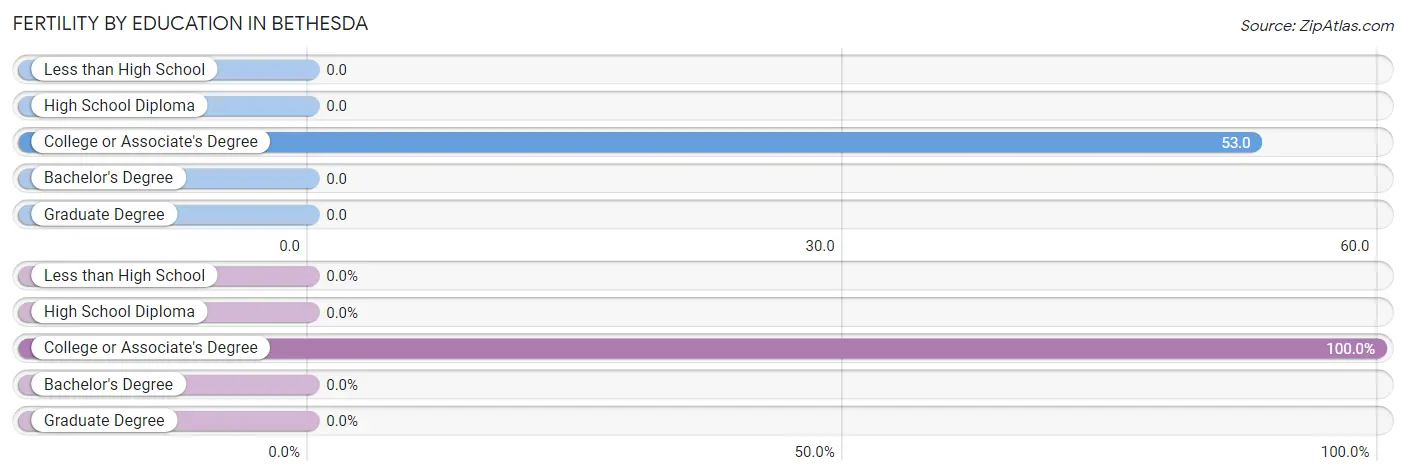
| Educational Attainment | Women with Births | Births / 1,000 Women |
| Less than High School | 0 (0.0%) | 0.0 |
| High School Diploma | 0 (0.0%) | 0.0 |
| College or Associate's Degree | 4 (100.0%) | 53.0 |
| Bachelor's Degree | 0 (0.0%) | 0.0 |
| Graduate Degree | 0 (0.0%) | 0.0 |
| Total | 4 (100.0%) | 14.0 |
Fertility by Education by Marriage Status in Bethesda
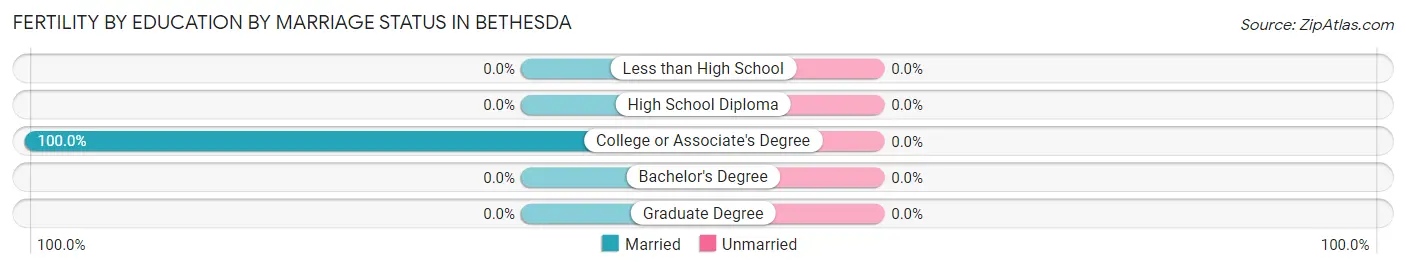
| Educational Attainment | Married | Unmarried |
| Less than High School | 0 (0.0%) | 0 (0.0%) |
| High School Diploma | 0 (0.0%) | 0 (0.0%) |
| College or Associate's Degree | 4 (100.0%) | 0 (0.0%) |
| Bachelor's Degree | 0 (0.0%) | 0 (0.0%) |
| Graduate Degree | 0 (0.0%) | 0 (0.0%) |
| Total | 4 (100.0%) | 0 (0.0%) |
Employment Characteristics in Bethesda
Employment by Class of Employer in Bethesda
Among the 514 employed individuals in Bethesda, private company employees (370 | 72.0%), local government employees (85 | 16.5%), and state government employees (21 | 4.1%) make up the most common classes of employment.
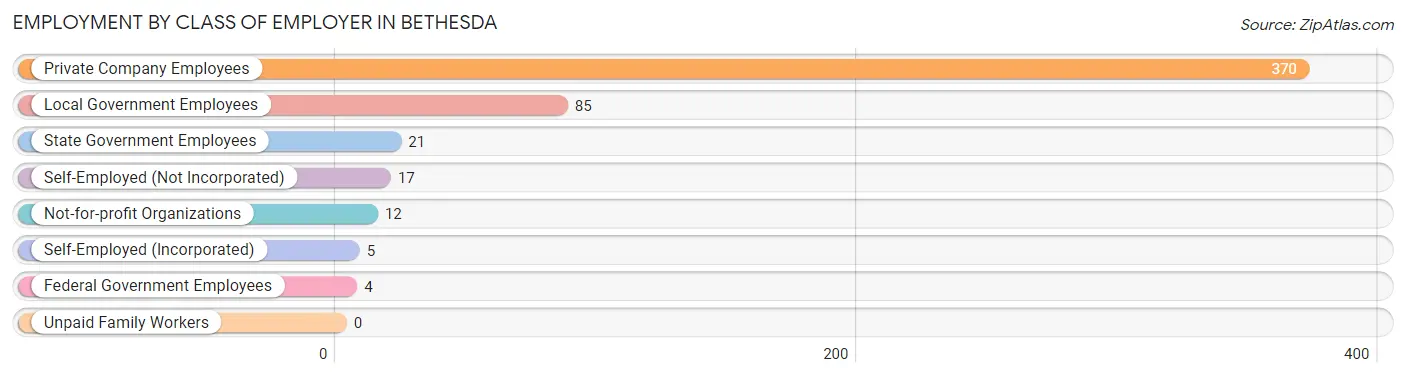
| Employer Class | # Employees | % Employees |
| Private Company Employees | 370 | 72.0% |
| Self-Employed (Incorporated) | 5 | 1.0% |
| Self-Employed (Not Incorporated) | 17 | 3.3% |
| Not-for-profit Organizations | 12 | 2.3% |
| Local Government Employees | 85 | 16.5% |
| State Government Employees | 21 | 4.1% |
| Federal Government Employees | 4 | 0.8% |
| Unpaid Family Workers | 0 | 0.0% |
| Total | 514 | 100.0% |
Employment Status by Age in Bethesda
According to the labor force statistics for Bethesda, out of the total population over 16 years of age (1,016), 53.9% or 548 individuals are in the labor force, with 5.5% or 30 of them unemployed. The age group with the highest labor force participation rate is 35 to 44 years, with 92.6% or 150 individuals in the labor force. Within the labor force, the 30 to 34 years age range has the highest percentage of unemployed individuals, with 25.5% or 12 of them being unemployed.
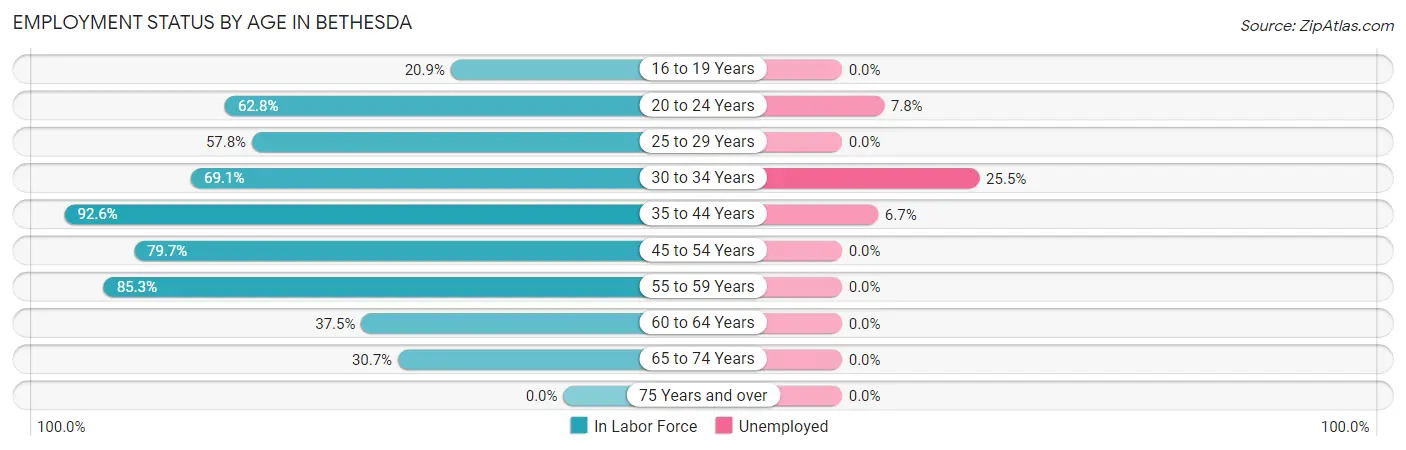
| Age Bracket | In Labor Force | Unemployed |
| 16 to 19 Years | 19 (20.9%) | 0 (0.0%) |
| 20 to 24 Years | 103 (62.8%) | 8 (7.8%) |
| 25 to 29 Years | 59 (57.8%) | 0 (0.0%) |
| 30 to 34 Years | 47 (69.1%) | 12 (25.5%) |
| 35 to 44 Years | 150 (92.6%) | 10 (6.7%) |
| 45 to 54 Years | 47 (79.7%) | 0 (0.0%) |
| 55 to 59 Years | 58 (85.3%) | 0 (0.0%) |
| 60 to 64 Years | 30 (37.5%) | 0 (0.0%) |
| 65 to 74 Years | 35 (30.7%) | 0 (0.0%) |
| 75 Years and over | 0 (0.0%) | 0 (0.0%) |
| Total | 548 (53.9%) | 30 (5.5%) |
Employment Status by Educational Attainment in Bethesda
According to labor force statistics for Bethesda, 72.5% of individuals (391) out of the total population between 25 and 64 years of age (539) are in the labor force, with 5.6% or 22 of them being unemployed. The group with the highest labor force participation rate are those with the educational attainment of bachelor's degree or higher, with 90.9% or 80 individuals in the labor force. Within the labor force, individuals with high school diploma education have the highest percentage of unemployment, with 7.2% or 10 of them being unemployed.
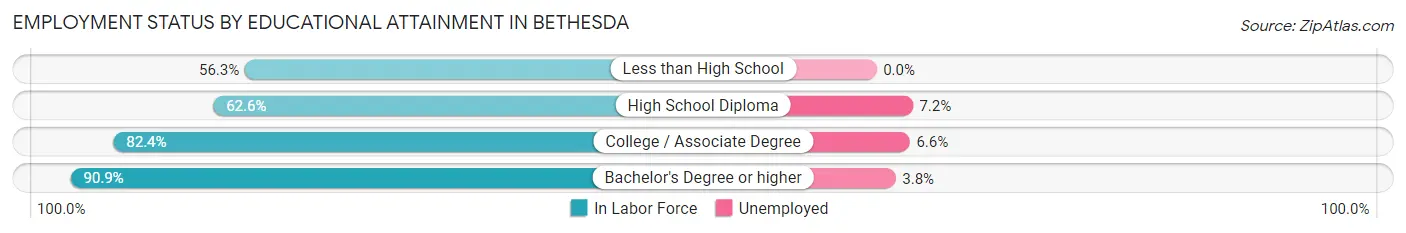
| Educational Attainment | In Labor Force | Unemployed |
| Less than High School | 36 (56.3%) | 0 (0.0%) |
| High School Diploma | 139 (62.6%) | 16 (7.2%) |
| College / Associate Degree | 136 (82.4%) | 11 (6.6%) |
| Bachelor's Degree or higher | 80 (90.9%) | 3 (3.8%) |
| Total | 391 (72.5%) | 30 (5.6%) |
Employment Occupations by Sex in Bethesda
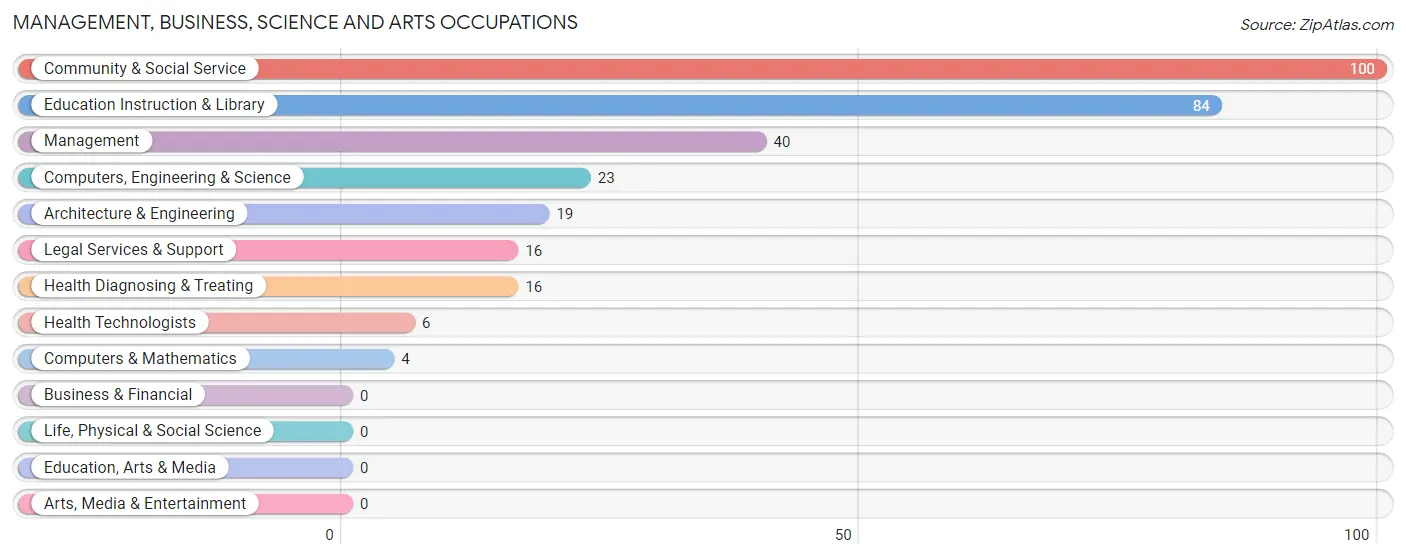
Management, Business, Science and Arts Occupations
The most common Management, Business, Science and Arts occupations in Bethesda are Community & Social Service (100 | 19.3%), Education Instruction & Library (84 | 16.2%), Management (40 | 7.7%), Computers, Engineering & Science (23 | 4.4%), and Architecture & Engineering (19 | 3.7%).
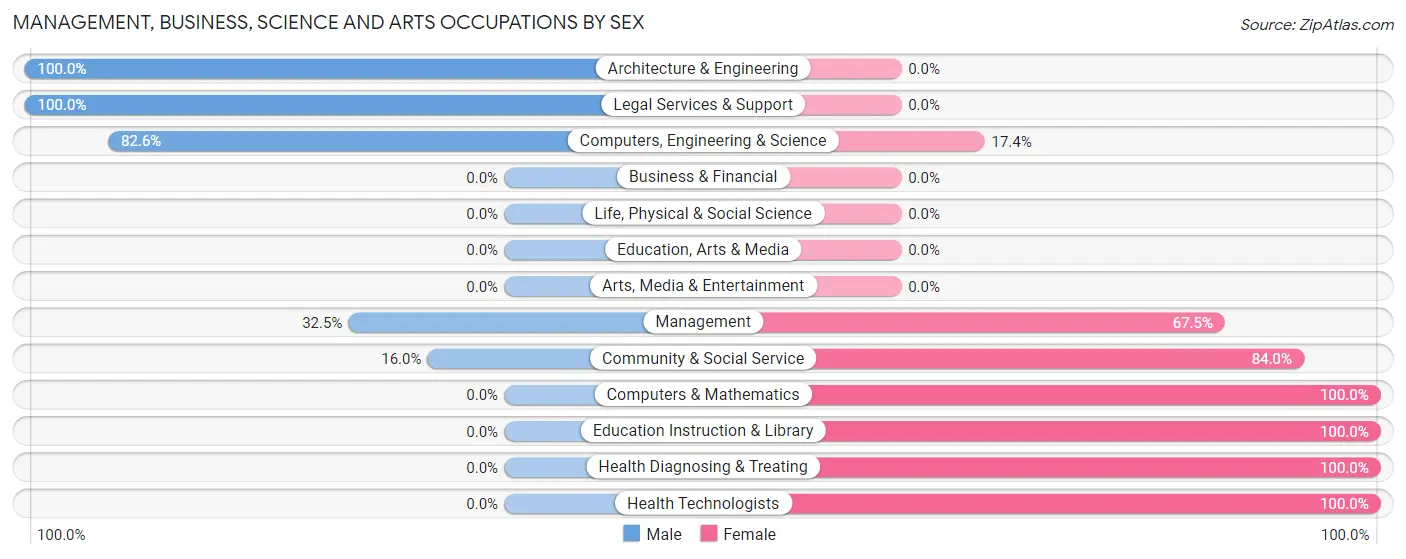
Management, Business, Science and Arts Occupations by Sex
Within the Management, Business, Science and Arts occupations in Bethesda, the most male-oriented occupations are Architecture & Engineering (100.0%), Legal Services & Support (100.0%), and Computers, Engineering & Science (82.6%), while the most female-oriented occupations are Computers & Mathematics (100.0%), Education Instruction & Library (100.0%), and Health Diagnosing & Treating (100.0%).
| Occupation | Male | Female |
| Management | 13 (32.5%) | 27 (67.5%) |
| Business & Financial | 0 (0.0%) | 0 (0.0%) |
| Computers, Engineering & Science | 19 (82.6%) | 4 (17.4%) |
| Computers & Mathematics | 0 (0.0%) | 4 (100.0%) |
| Architecture & Engineering | 19 (100.0%) | 0 (0.0%) |
| Life, Physical & Social Science | 0 (0.0%) | 0 (0.0%) |
| Community & Social Service | 16 (16.0%) | 84 (84.0%) |
| Education, Arts & Media | 0 (0.0%) | 0 (0.0%) |
| Legal Services & Support | 16 (100.0%) | 0 (0.0%) |
| Education Instruction & Library | 0 (0.0%) | 84 (100.0%) |
| Arts, Media & Entertainment | 0 (0.0%) | 0 (0.0%) |
| Health Diagnosing & Treating | 0 (0.0%) | 16 (100.0%) |
| Health Technologists | 0 (0.0%) | 6 (100.0%) |
| Total (Category) | 48 (26.8%) | 131 (73.2%) |
| Total (Overall) | 267 (51.5%) | 251 (48.5%) |
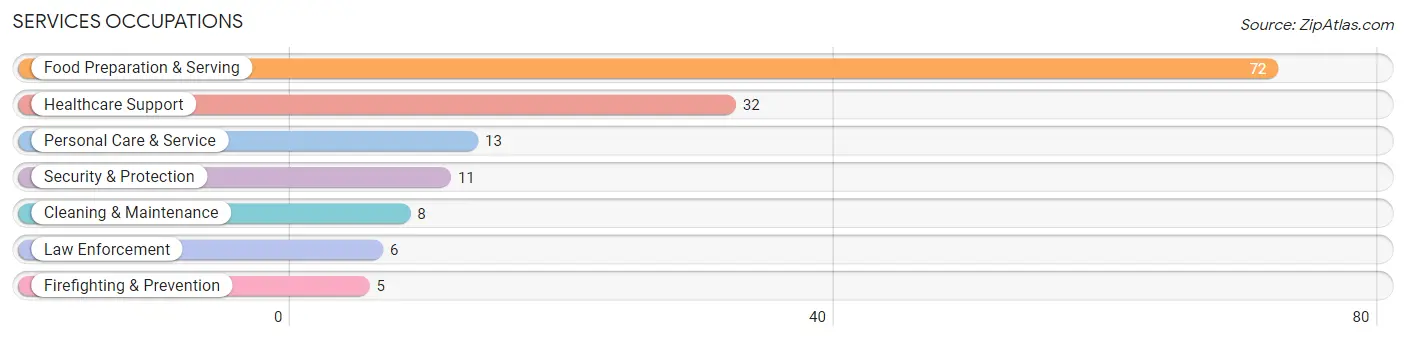
Services Occupations
The most common Services occupations in Bethesda are Food Preparation & Serving (72 | 13.9%), Healthcare Support (32 | 6.2%), Personal Care & Service (13 | 2.5%), Security & Protection (11 | 2.1%), and Cleaning & Maintenance (8 | 1.5%).
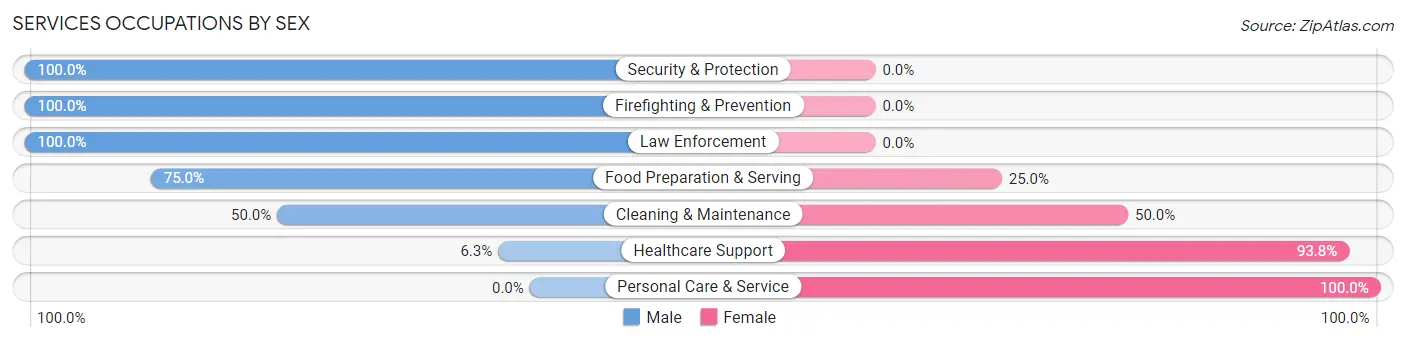
Services Occupations by Sex
Within the Services occupations in Bethesda, the most male-oriented occupations are Security & Protection (100.0%), Firefighting & Prevention (100.0%), and Law Enforcement (100.0%), while the most female-oriented occupations are Personal Care & Service (100.0%), Healthcare Support (93.8%), and Cleaning & Maintenance (50.0%).
| Occupation | Male | Female |
| Healthcare Support | 2 (6.2%) | 30 (93.8%) |
| Security & Protection | 11 (100.0%) | 0 (0.0%) |
| Firefighting & Prevention | 5 (100.0%) | 0 (0.0%) |
| Law Enforcement | 6 (100.0%) | 0 (0.0%) |
| Food Preparation & Serving | 54 (75.0%) | 18 (25.0%) |
| Cleaning & Maintenance | 4 (50.0%) | 4 (50.0%) |
| Personal Care & Service | 0 (0.0%) | 13 (100.0%) |
| Total (Category) | 71 (52.2%) | 65 (47.8%) |
| Total (Overall) | 267 (51.5%) | 251 (48.5%) |
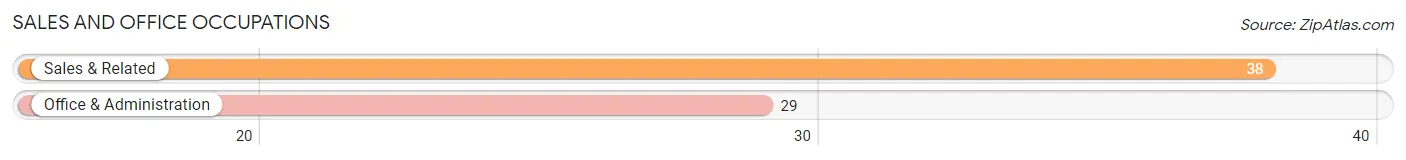
Sales and Office Occupations
The most common Sales and Office occupations in Bethesda are Sales & Related (38 | 7.3%), and Office & Administration (29 | 5.6%).
Sales and Office Occupations by Sex
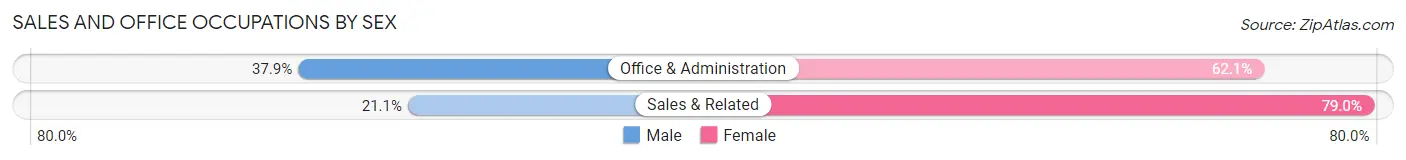
| Occupation | Male | Female |
| Sales & Related | 8 (21.0%) | 30 (78.9%) |
| Office & Administration | 11 (37.9%) | 18 (62.1%) |
| Total (Category) | 19 (28.4%) | 48 (71.6%) |
| Total (Overall) | 267 (51.5%) | 251 (48.5%) |
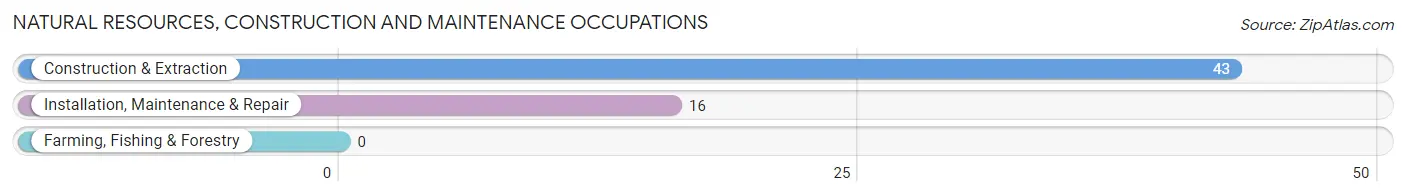
Natural Resources, Construction and Maintenance Occupations
The most common Natural Resources, Construction and Maintenance occupations in Bethesda are Construction & Extraction (43 | 8.3%), and Installation, Maintenance & Repair (16 | 3.1%).
Natural Resources, Construction and Maintenance Occupations by Sex
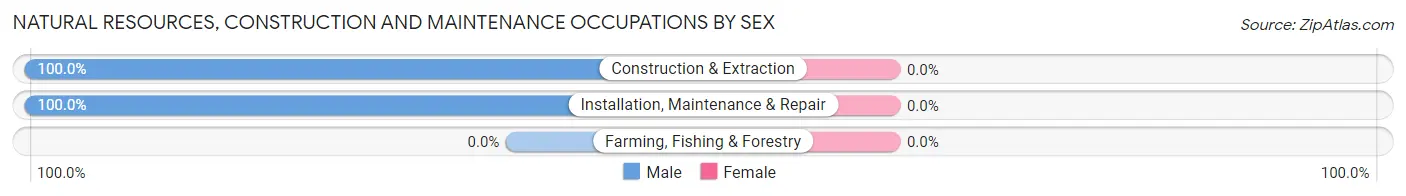
| Occupation | Male | Female |
| Farming, Fishing & Forestry | 0 (0.0%) | 0 (0.0%) |
| Construction & Extraction | 43 (100.0%) | 0 (0.0%) |
| Installation, Maintenance & Repair | 16 (100.0%) | 0 (0.0%) |
| Total (Category) | 59 (100.0%) | 0 (0.0%) |
| Total (Overall) | 267 (51.5%) | 251 (48.5%) |
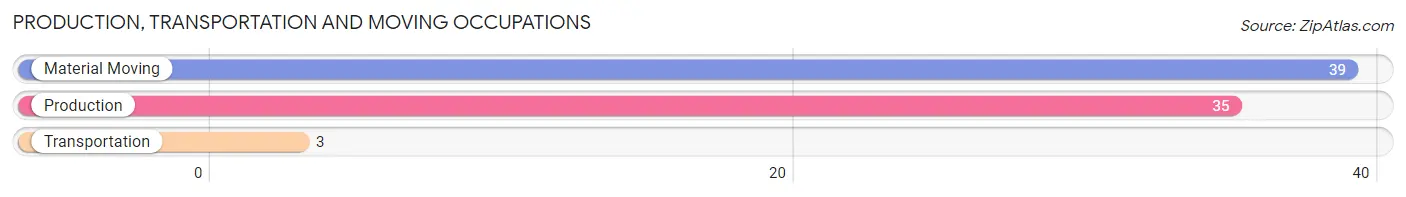
Production, Transportation and Moving Occupations
The most common Production, Transportation and Moving occupations in Bethesda are Material Moving (39 | 7.5%), Production (35 | 6.8%), and Transportation (3 | 0.6%).
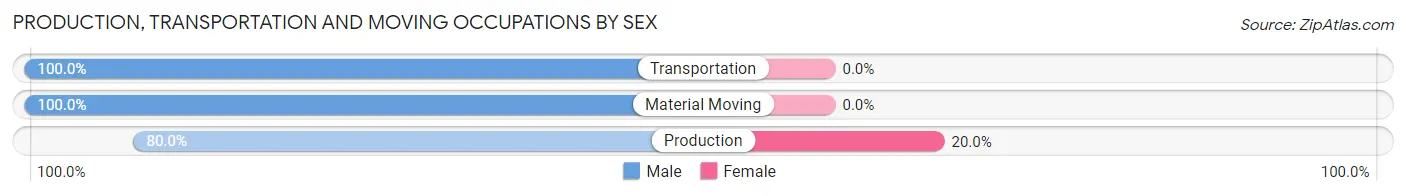
Production, Transportation and Moving Occupations by Sex
| Occupation | Male | Female |
| Production | 28 (80.0%) | 7 (20.0%) |
| Transportation | 3 (100.0%) | 0 (0.0%) |
| Material Moving | 39 (100.0%) | 0 (0.0%) |
| Total (Category) | 70 (90.9%) | 7 (9.1%) |
| Total (Overall) | 267 (51.5%) | 251 (48.5%) |
Employment Industries by Sex in Bethesda
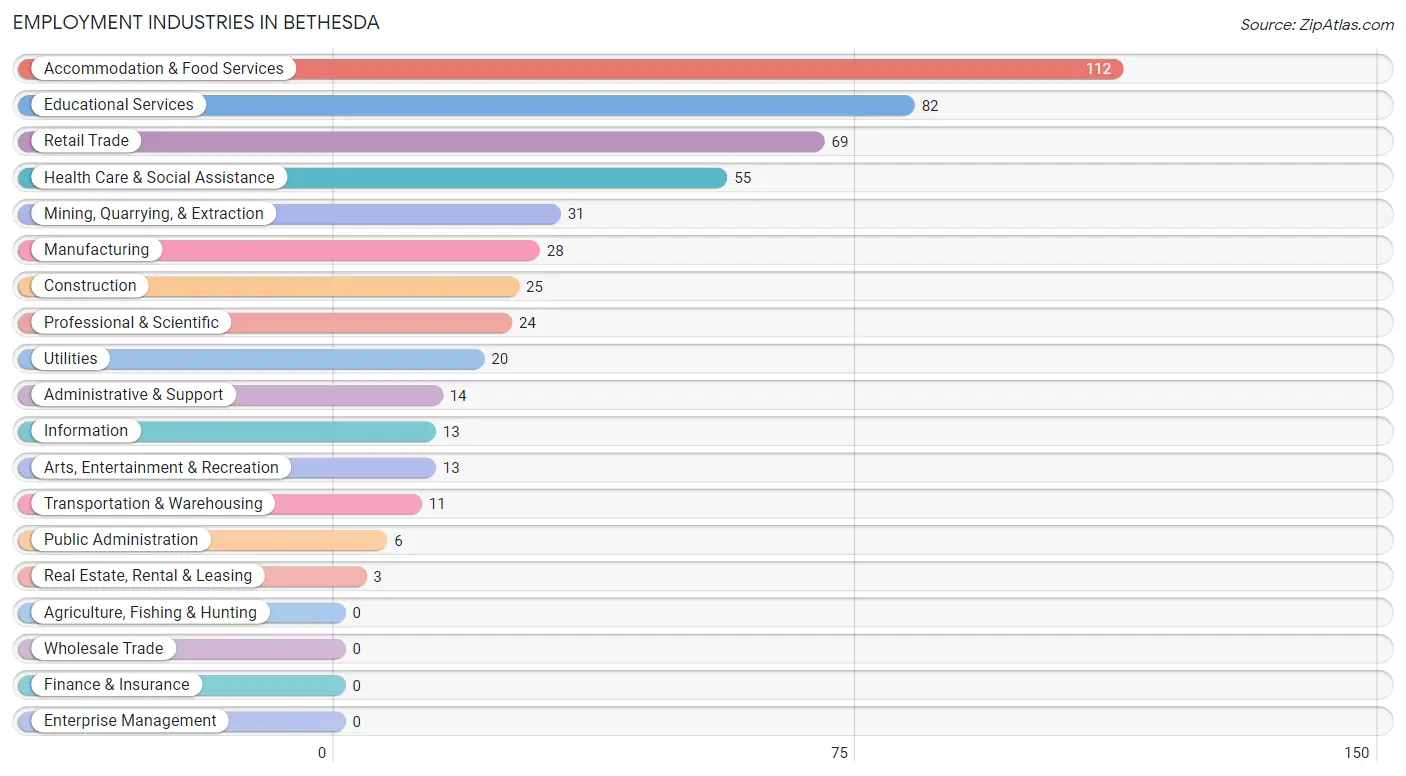
Employment Industries in Bethesda
The major employment industries in Bethesda include Accommodation & Food Services (112 | 21.6%), Educational Services (82 | 15.8%), Retail Trade (69 | 13.3%), Health Care & Social Assistance (55 | 10.6%), and Mining, Quarrying, & Extraction (31 | 6.0%).
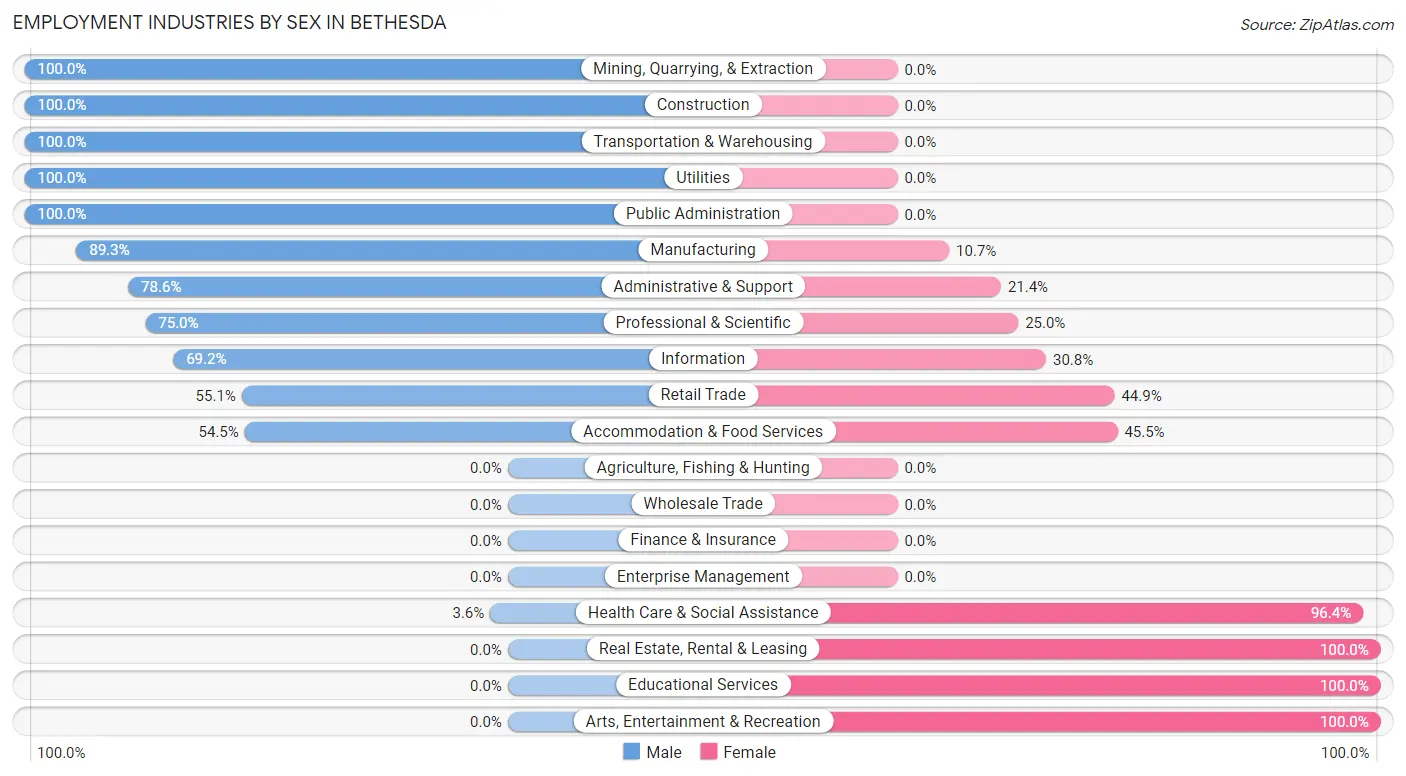
Employment Industries by Sex in Bethesda
The Bethesda industries that see more men than women are Mining, Quarrying, & Extraction (100.0%), Construction (100.0%), and Transportation & Warehousing (100.0%), whereas the industries that tend to have a higher number of women are Real Estate, Rental & Leasing (100.0%), Educational Services (100.0%), and Arts, Entertainment & Recreation (100.0%).
| Industry | Male | Female |
| Agriculture, Fishing & Hunting | 0 (0.0%) | 0 (0.0%) |
| Mining, Quarrying, & Extraction | 31 (100.0%) | 0 (0.0%) |
| Construction | 25 (100.0%) | 0 (0.0%) |
| Manufacturing | 25 (89.3%) | 3 (10.7%) |
| Wholesale Trade | 0 (0.0%) | 0 (0.0%) |
| Retail Trade | 38 (55.1%) | 31 (44.9%) |
| Transportation & Warehousing | 11 (100.0%) | 0 (0.0%) |
| Utilities | 20 (100.0%) | 0 (0.0%) |
| Information | 9 (69.2%) | 4 (30.8%) |
| Finance & Insurance | 0 (0.0%) | 0 (0.0%) |
| Real Estate, Rental & Leasing | 0 (0.0%) | 3 (100.0%) |
| Professional & Scientific | 18 (75.0%) | 6 (25.0%) |
| Enterprise Management | 0 (0.0%) | 0 (0.0%) |
| Administrative & Support | 11 (78.6%) | 3 (21.4%) |
| Educational Services | 0 (0.0%) | 82 (100.0%) |
| Health Care & Social Assistance | 2 (3.6%) | 53 (96.4%) |
| Arts, Entertainment & Recreation | 0 (0.0%) | 13 (100.0%) |
| Accommodation & Food Services | 61 (54.5%) | 51 (45.5%) |
| Public Administration | 6 (100.0%) | 0 (0.0%) |
| Total | 267 (51.5%) | 251 (48.5%) |
Education in Bethesda
School Enrollment in Bethesda
The most common levels of schooling among the 253 students in Bethesda are high school (67 | 26.5%), college / undergraduate (62 | 24.5%), and elementary school (40 | 15.8%).
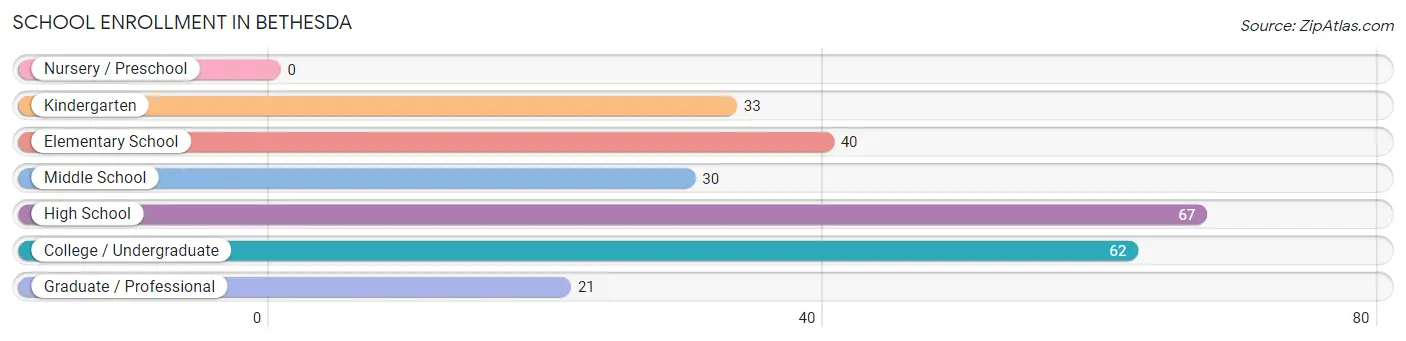
| School Level | # Students | % Students |
| Nursery / Preschool | 0 | 0.0% |
| Kindergarten | 33 | 13.0% |
| Elementary School | 40 | 15.8% |
| Middle School | 30 | 11.9% |
| High School | 67 | 26.5% |
| College / Undergraduate | 62 | 24.5% |
| Graduate / Professional | 21 | 8.3% |
| Total | 253 | 100.0% |
School Enrollment by Age by Funding Source in Bethesda
Out of a total of 253 students who are enrolled in schools in Bethesda, 51 (20.2%) attend a private institution, while the remaining 202 (79.8%) are enrolled in public schools. The age group of 3 to 4 year olds has the highest likelihood of being enrolled in private schools, with 5 (100.0% in the age bracket) enrolled. Conversely, the age group of 10 to 14 year olds has the lowest likelihood of being enrolled in a private school, with 59 (100.0% in the age bracket) attending a public institution.
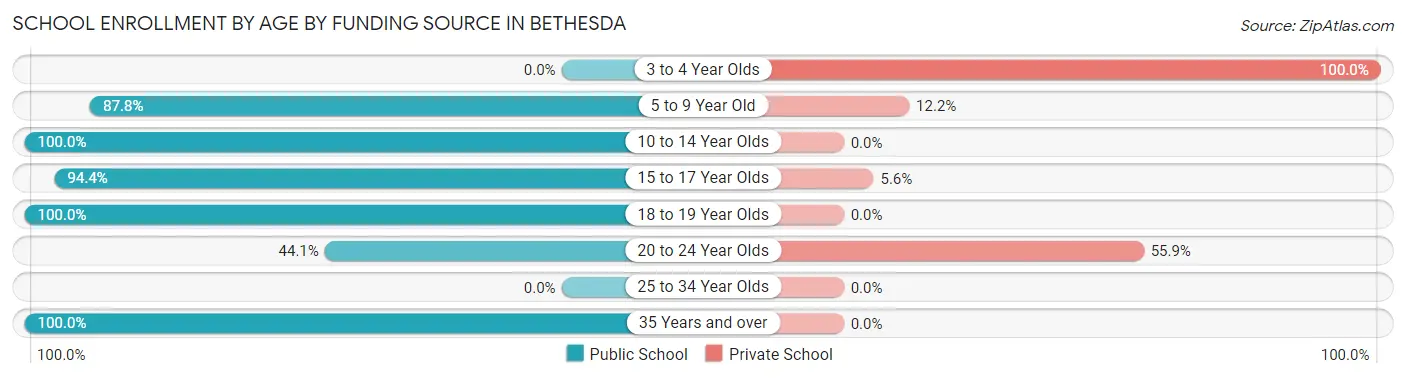
| Age Bracket | Public School | Private School |
| 3 to 4 Year Olds | 0 (0.0%) | 5 (100.0%) |
| 5 to 9 Year Old | 36 (87.8%) | 5 (12.2%) |
| 10 to 14 Year Olds | 59 (100.0%) | 0 (0.0%) |
| 15 to 17 Year Olds | 51 (94.4%) | 3 (5.6%) |
| 18 to 19 Year Olds | 24 (100.0%) | 0 (0.0%) |
| 20 to 24 Year Olds | 30 (44.1%) | 38 (55.9%) |
| 25 to 34 Year Olds | 0 (0.0%) | 0 (0.0%) |
| 35 Years and over | 2 (100.0%) | 0 (0.0%) |
| Total | 202 (79.8%) | 51 (20.2%) |
Educational Attainment by Field of Study in Bethesda
Education (55 | 53.9%), business (14 | 13.7%), social sciences (11 | 10.8%), arts & humanities (10 | 9.8%), and liberal arts & history (8 | 7.8%) are the most common fields of study among 102 individuals in Bethesda who have obtained a bachelor's degree or higher.
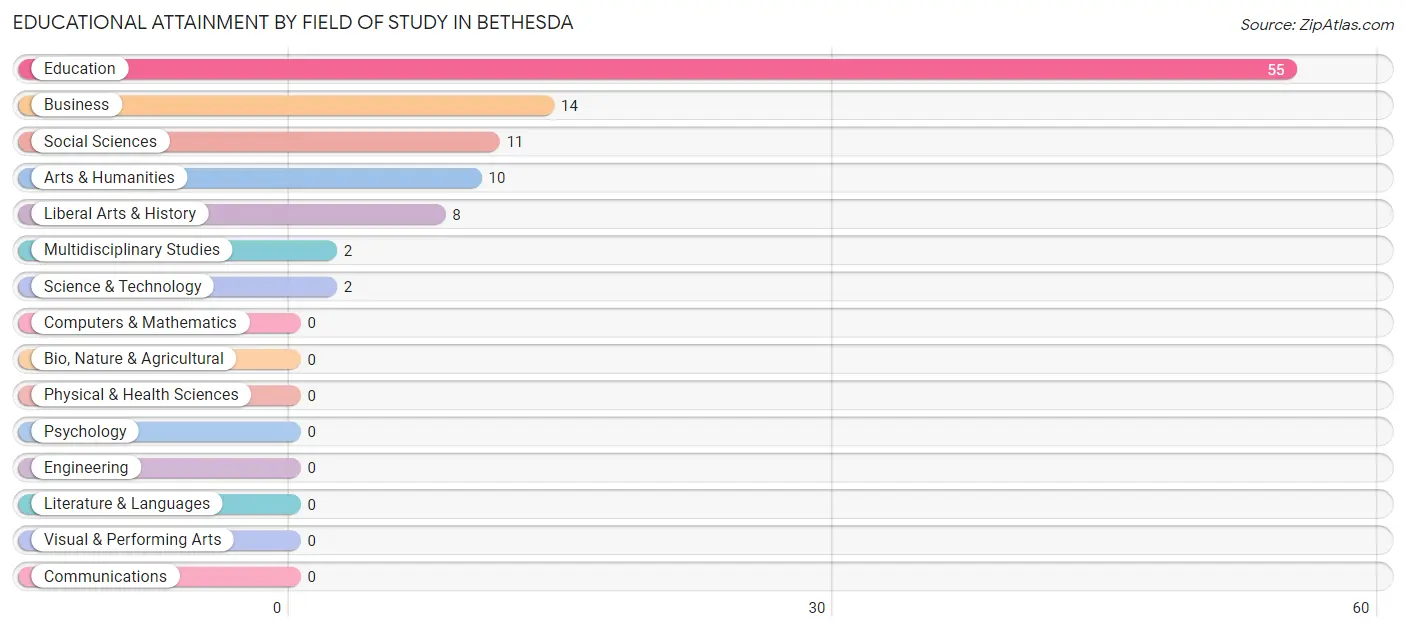
| Field of Study | # Graduates | % Graduates |
| Computers & Mathematics | 0 | 0.0% |
| Bio, Nature & Agricultural | 0 | 0.0% |
| Physical & Health Sciences | 0 | 0.0% |
| Psychology | 0 | 0.0% |
| Social Sciences | 11 | 10.8% |
| Engineering | 0 | 0.0% |
| Multidisciplinary Studies | 2 | 2.0% |
| Science & Technology | 2 | 2.0% |
| Business | 14 | 13.7% |
| Education | 55 | 53.9% |
| Literature & Languages | 0 | 0.0% |
| Liberal Arts & History | 8 | 7.8% |
| Visual & Performing Arts | 0 | 0.0% |
| Communications | 0 | 0.0% |
| Arts & Humanities | 10 | 9.8% |
| Total | 102 | 100.0% |
Transportation & Commute in Bethesda
Vehicle Availability by Sex in Bethesda
The most prevalent vehicle ownership categories in Bethesda are males with 2 vehicles (144, accounting for 54.7%) and females with 2 vehicles (128, making up 57.4%).
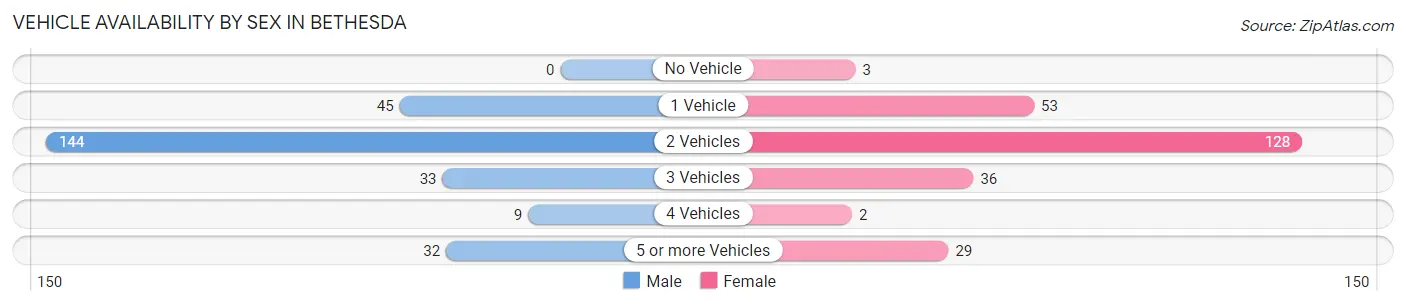
| Vehicles Available | Male | Female |
| No Vehicle | 0 (0.0%) | 3 (1.2%) |
| 1 Vehicle | 45 (17.1%) | 53 (21.1%) |
| 2 Vehicles | 144 (54.7%) | 128 (51.0%) |
| 3 Vehicles | 33 (12.6%) | 36 (14.3%) |
| 4 Vehicles | 9 (3.4%) | 2 (0.8%) |
| 5 or more Vehicles | 32 (12.2%) | 29 (11.6%) |
| Total | 263 (100.0%) | 251 (100.0%) |
Commute Time in Bethesda
The most frequently occuring commute durations in Bethesda are 15 to 19 minutes (120 commuters, 23.5%), 10 to 14 minutes (110 commuters, 21.6%), and 30 to 34 minutes (67 commuters, 13.1%).
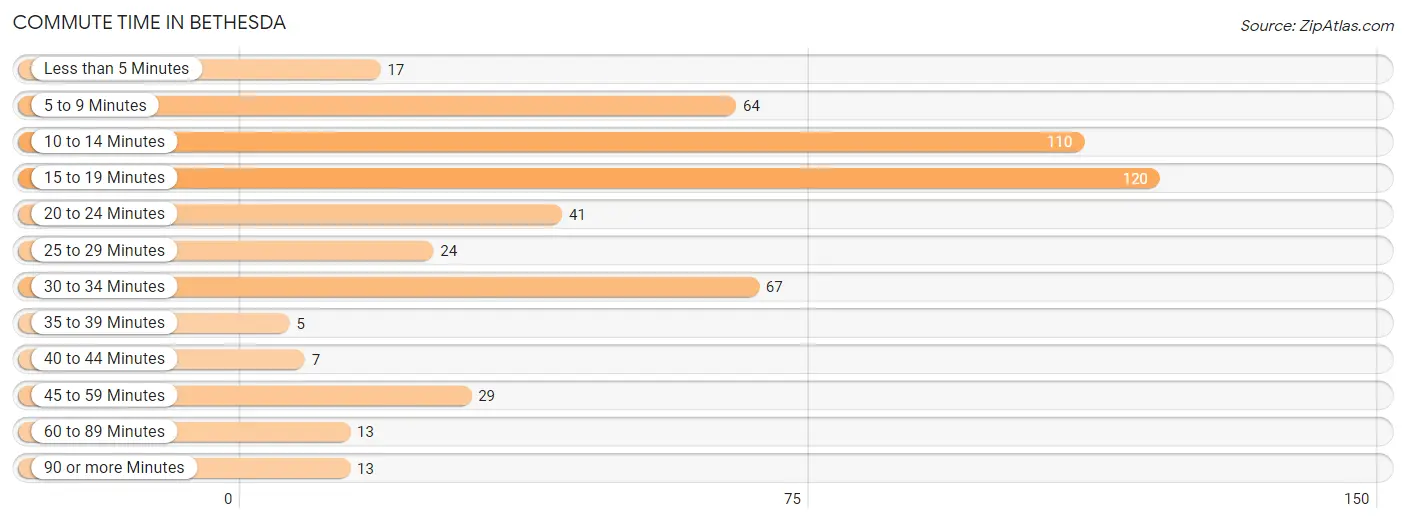
| Commute Time | # Commuters | % Commuters |
| Less than 5 Minutes | 17 | 3.3% |
| 5 to 9 Minutes | 64 | 12.6% |
| 10 to 14 Minutes | 110 | 21.6% |
| 15 to 19 Minutes | 120 | 23.5% |
| 20 to 24 Minutes | 41 | 8.0% |
| 25 to 29 Minutes | 24 | 4.7% |
| 30 to 34 Minutes | 67 | 13.1% |
| 35 to 39 Minutes | 5 | 1.0% |
| 40 to 44 Minutes | 7 | 1.4% |
| 45 to 59 Minutes | 29 | 5.7% |
| 60 to 89 Minutes | 13 | 2.5% |
| 90 or more Minutes | 13 | 2.5% |
Commute Time by Sex in Bethesda
The most common commute times in Bethesda are 15 to 19 minutes (81 commuters, 31.0%) for males and 10 to 14 minutes (74 commuters, 29.7%) for females.
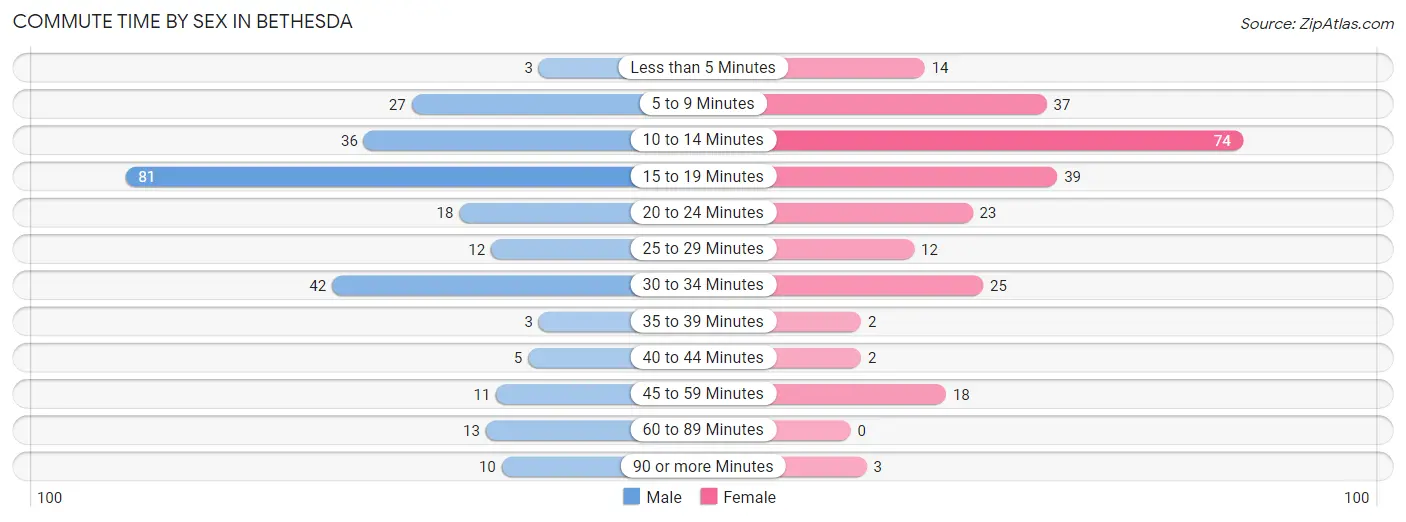
| Commute Time | Male | Female |
| Less than 5 Minutes | 3 (1.1%) | 14 (5.6%) |
| 5 to 9 Minutes | 27 (10.3%) | 37 (14.9%) |
| 10 to 14 Minutes | 36 (13.8%) | 74 (29.7%) |
| 15 to 19 Minutes | 81 (31.0%) | 39 (15.7%) |
| 20 to 24 Minutes | 18 (6.9%) | 23 (9.2%) |
| 25 to 29 Minutes | 12 (4.6%) | 12 (4.8%) |
| 30 to 34 Minutes | 42 (16.1%) | 25 (10.0%) |
| 35 to 39 Minutes | 3 (1.1%) | 2 (0.8%) |
| 40 to 44 Minutes | 5 (1.9%) | 2 (0.8%) |
| 45 to 59 Minutes | 11 (4.2%) | 18 (7.2%) |
| 60 to 89 Minutes | 13 (5.0%) | 0 (0.0%) |
| 90 or more Minutes | 10 (3.8%) | 3 (1.2%) |
Time of Departure to Work by Sex in Bethesda
The most frequent times of departure to work in Bethesda are 6:00 AM to 6:29 AM (43, 16.5%) for males and 7:00 AM to 7:29 AM (56, 22.5%) for females.
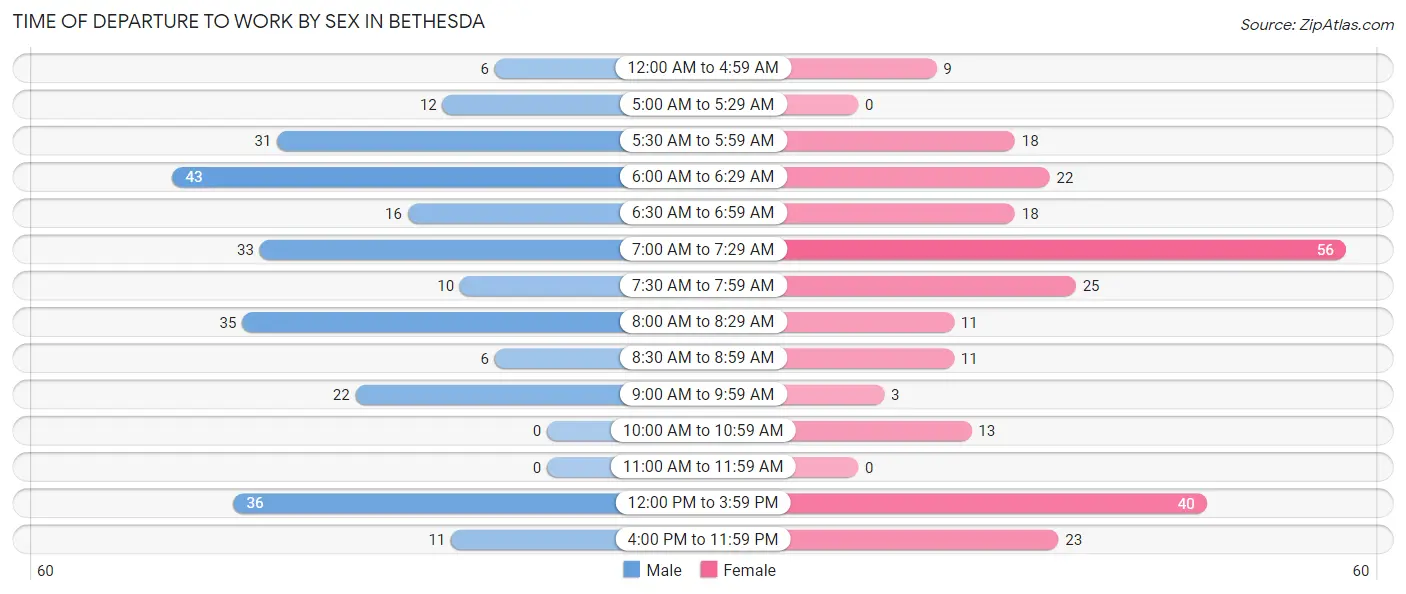
| Time of Departure | Male | Female |
| 12:00 AM to 4:59 AM | 6 (2.3%) | 9 (3.6%) |
| 5:00 AM to 5:29 AM | 12 (4.6%) | 0 (0.0%) |
| 5:30 AM to 5:59 AM | 31 (11.9%) | 18 (7.2%) |
| 6:00 AM to 6:29 AM | 43 (16.5%) | 22 (8.8%) |
| 6:30 AM to 6:59 AM | 16 (6.1%) | 18 (7.2%) |
| 7:00 AM to 7:29 AM | 33 (12.6%) | 56 (22.5%) |
| 7:30 AM to 7:59 AM | 10 (3.8%) | 25 (10.0%) |
| 8:00 AM to 8:29 AM | 35 (13.4%) | 11 (4.4%) |
| 8:30 AM to 8:59 AM | 6 (2.3%) | 11 (4.4%) |
| 9:00 AM to 9:59 AM | 22 (8.4%) | 3 (1.2%) |
| 10:00 AM to 10:59 AM | 0 (0.0%) | 13 (5.2%) |
| 11:00 AM to 11:59 AM | 0 (0.0%) | 0 (0.0%) |
| 12:00 PM to 3:59 PM | 36 (13.8%) | 40 (16.1%) |
| 4:00 PM to 11:59 PM | 11 (4.2%) | 23 (9.2%) |
| Total | 261 (100.0%) | 249 (100.0%) |
Housing Occupancy in Bethesda
Occupancy by Ownership in Bethesda
Of the total 512 dwellings in Bethesda, owner-occupied units account for 344 (67.2%), while renter-occupied units make up 168 (32.8%).
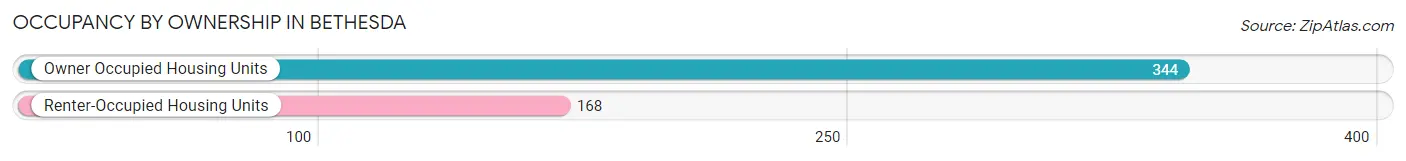
| Occupancy | # Housing Units | % Housing Units |
| Owner Occupied Housing Units | 344 | 67.2% |
| Renter-Occupied Housing Units | 168 | 32.8% |
| Total Occupied Housing Units | 512 | 100.0% |
Occupancy by Household Size in Bethesda
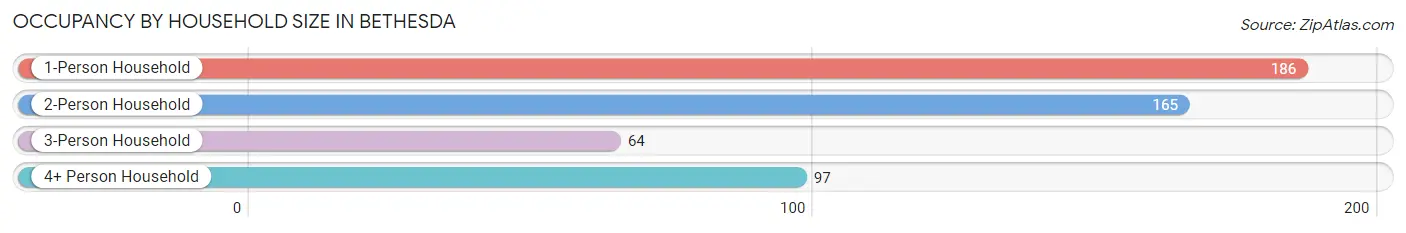
| Household Size | # Housing Units | % Housing Units |
| 1-Person Household | 186 | 36.3% |
| 2-Person Household | 165 | 32.2% |
| 3-Person Household | 64 | 12.5% |
| 4+ Person Household | 97 | 19.0% |
| Total Housing Units | 512 | 100.0% |
Occupancy by Ownership by Household Size in Bethesda
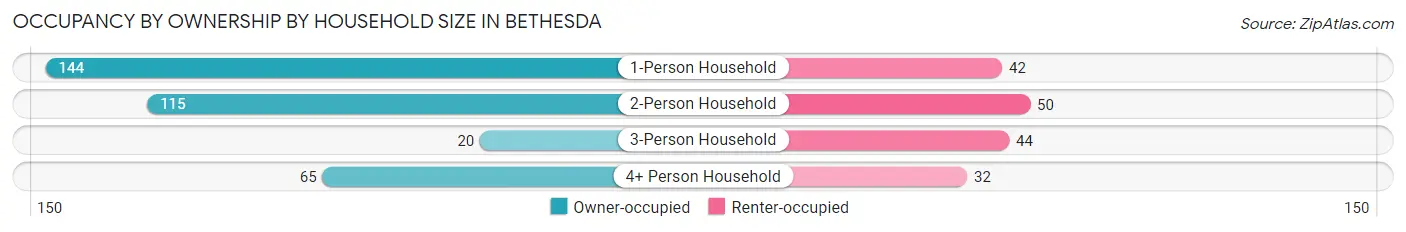
| Household Size | Owner-occupied | Renter-occupied |
| 1-Person Household | 144 (77.4%) | 42 (22.6%) |
| 2-Person Household | 115 (69.7%) | 50 (30.3%) |
| 3-Person Household | 20 (31.2%) | 44 (68.8%) |
| 4+ Person Household | 65 (67.0%) | 32 (33.0%) |
| Total Housing Units | 344 (67.2%) | 168 (32.8%) |
Occupancy by Educational Attainment in Bethesda
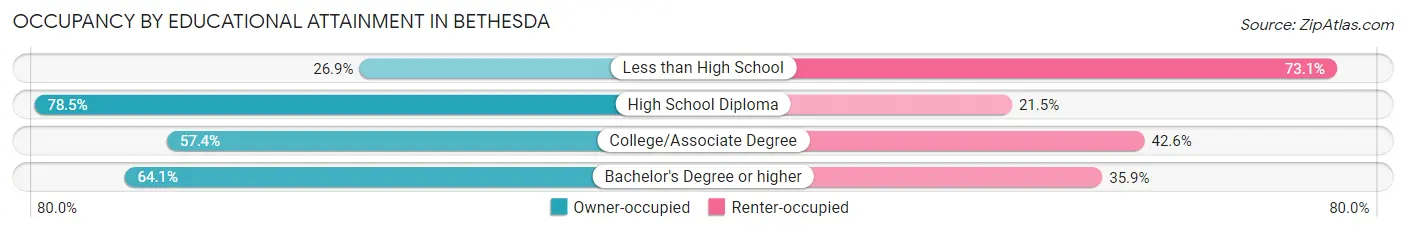
| Household Size | Owner-occupied | Renter-occupied |
| Less than High School | 7 (26.9%) | 19 (73.1%) |
| High School Diploma | 193 (78.5%) | 53 (21.5%) |
| College/Associate Degree | 85 (57.4%) | 63 (42.6%) |
| Bachelor's Degree or higher | 59 (64.1%) | 33 (35.9%) |
Occupancy by Age of Householder in Bethesda
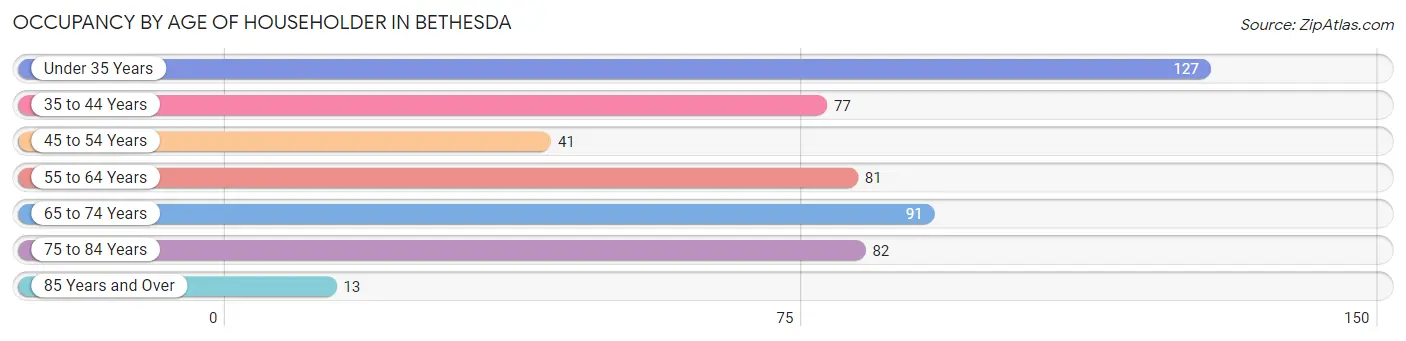
| Age Bracket | # Households | % Households |
| Under 35 Years | 127 | 24.8% |
| 35 to 44 Years | 77 | 15.0% |
| 45 to 54 Years | 41 | 8.0% |
| 55 to 64 Years | 81 | 15.8% |
| 65 to 74 Years | 91 | 17.8% |
| 75 to 84 Years | 82 | 16.0% |
| 85 Years and Over | 13 | 2.5% |
| Total | 512 | 100.0% |
Housing Finances in Bethesda
Median Income by Occupancy in Bethesda
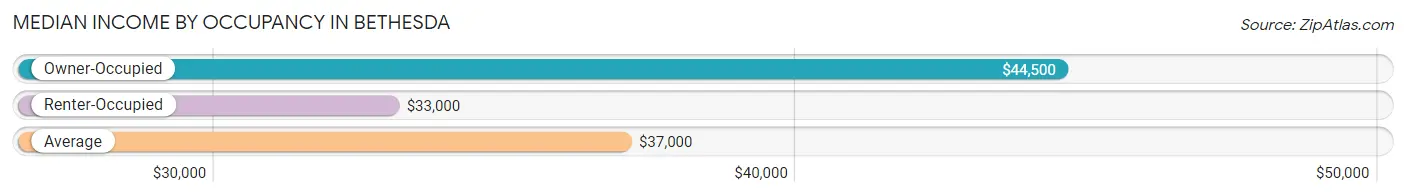
| Occupancy Type | # Households | Median Income |
| Owner-Occupied | 344 (67.2%) | $44,500 |
| Renter-Occupied | 168 (32.8%) | $33,000 |
| Average | 512 (100.0%) | $37,000 |
Occupancy by Householder Income Bracket in Bethesda
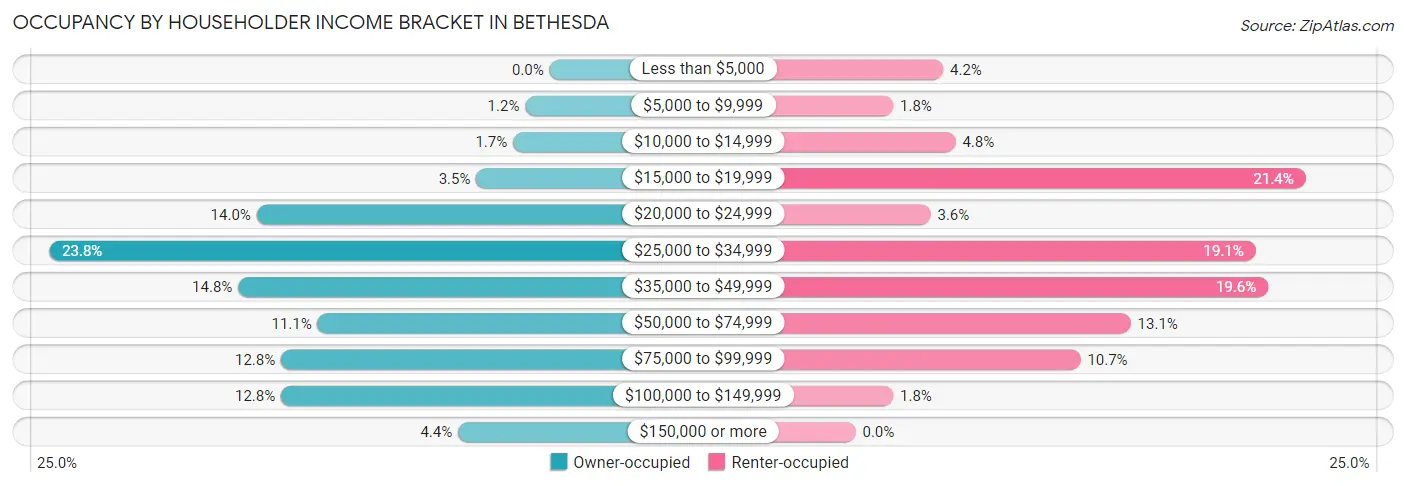
| Income Bracket | Owner-occupied | Renter-occupied |
| Less than $5,000 | 0 (0.0%) | 7 (4.2%) |
| $5,000 to $9,999 | 4 (1.2%) | 3 (1.8%) |
| $10,000 to $14,999 | 6 (1.7%) | 8 (4.8%) |
| $15,000 to $19,999 | 12 (3.5%) | 36 (21.4%) |
| $20,000 to $24,999 | 48 (14.0%) | 6 (3.6%) |
| $25,000 to $34,999 | 82 (23.8%) | 32 (19.1%) |
| $35,000 to $49,999 | 51 (14.8%) | 33 (19.6%) |
| $50,000 to $74,999 | 38 (11.1%) | 22 (13.1%) |
| $75,000 to $99,999 | 44 (12.8%) | 18 (10.7%) |
| $100,000 to $149,999 | 44 (12.8%) | 3 (1.8%) |
| $150,000 or more | 15 (4.4%) | 0 (0.0%) |
| Total | 344 (100.0%) | 168 (100.0%) |
Monthly Housing Cost Tiers in Bethesda
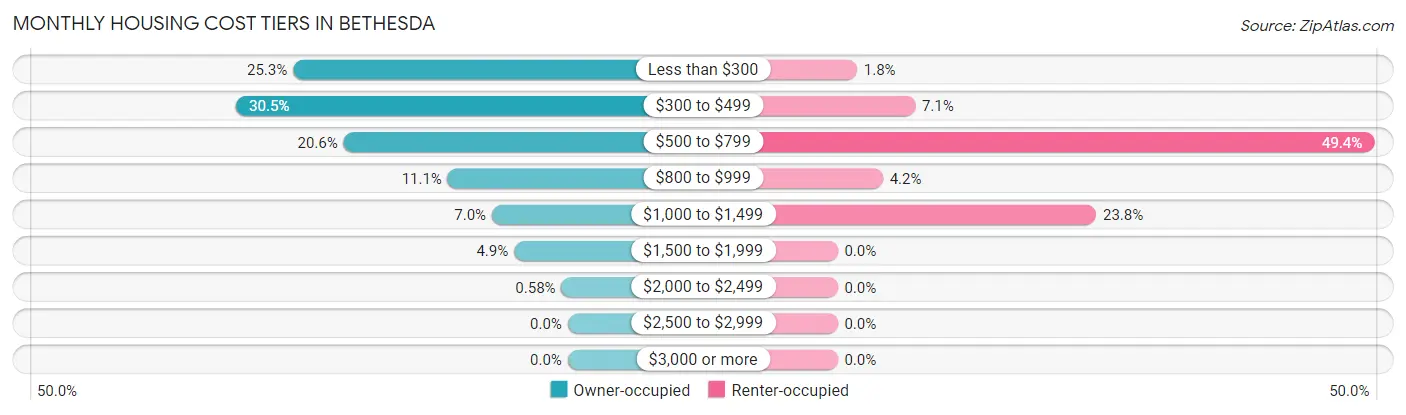
| Monthly Cost | Owner-occupied | Renter-occupied |
| Less than $300 | 87 (25.3%) | 3 (1.8%) |
| $300 to $499 | 105 (30.5%) | 12 (7.1%) |
| $500 to $799 | 71 (20.6%) | 83 (49.4%) |
| $800 to $999 | 38 (11.1%) | 7 (4.2%) |
| $1,000 to $1,499 | 24 (7.0%) | 40 (23.8%) |
| $1,500 to $1,999 | 17 (4.9%) | 0 (0.0%) |
| $2,000 to $2,499 | 2 (0.6%) | 0 (0.0%) |
| $2,500 to $2,999 | 0 (0.0%) | 0 (0.0%) |
| $3,000 or more | 0 (0.0%) | 0 (0.0%) |
| Total | 344 (100.0%) | 168 (100.0%) |
Physical Housing Characteristics in Bethesda
Housing Structures in Bethesda
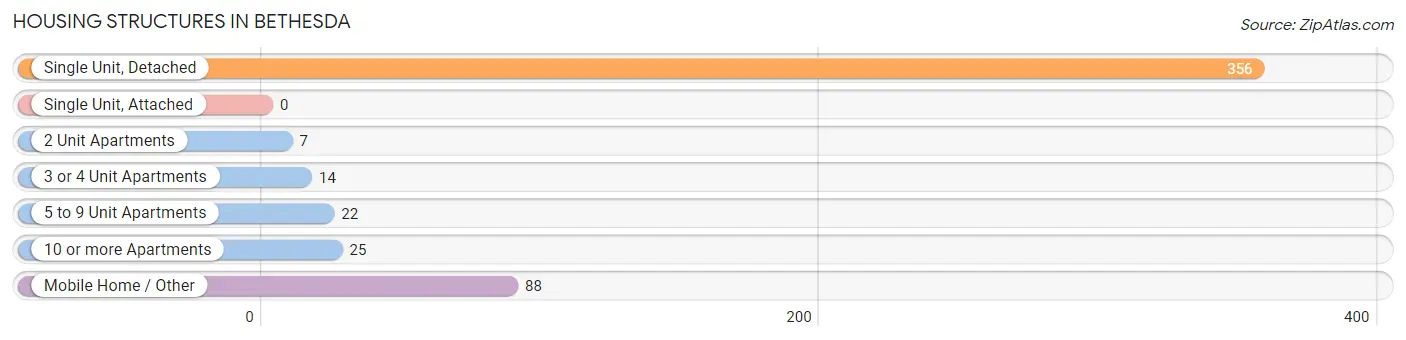
| Structure Type | # Housing Units | % Housing Units |
| Single Unit, Detached | 356 | 69.5% |
| Single Unit, Attached | 0 | 0.0% |
| 2 Unit Apartments | 7 | 1.4% |
| 3 or 4 Unit Apartments | 14 | 2.7% |
| 5 to 9 Unit Apartments | 22 | 4.3% |
| 10 or more Apartments | 25 | 4.9% |
| Mobile Home / Other | 88 | 17.2% |
| Total | 512 | 100.0% |
Housing Structures by Occupancy in Bethesda
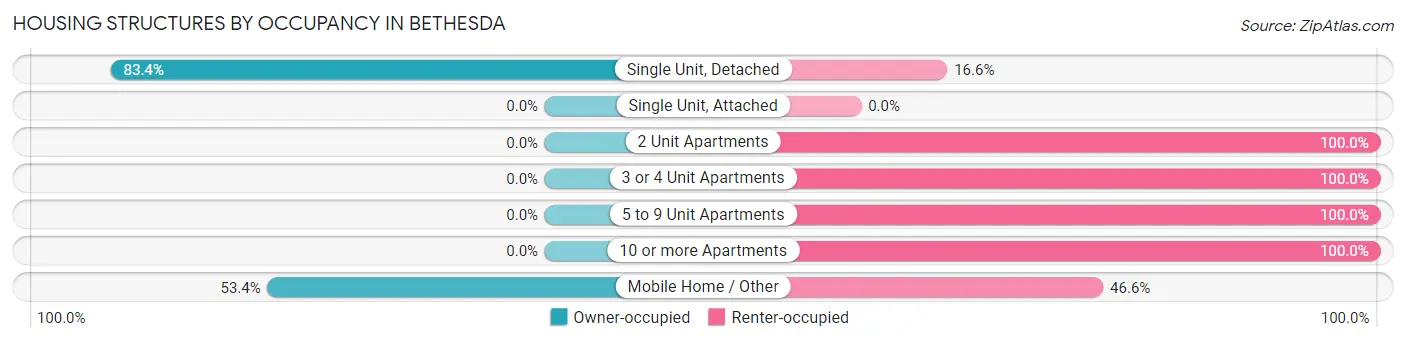
| Structure Type | Owner-occupied | Renter-occupied |
| Single Unit, Detached | 297 (83.4%) | 59 (16.6%) |
| Single Unit, Attached | 0 (0.0%) | 0 (0.0%) |
| 2 Unit Apartments | 0 (0.0%) | 7 (100.0%) |
| 3 or 4 Unit Apartments | 0 (0.0%) | 14 (100.0%) |
| 5 to 9 Unit Apartments | 0 (0.0%) | 22 (100.0%) |
| 10 or more Apartments | 0 (0.0%) | 25 (100.0%) |
| Mobile Home / Other | 47 (53.4%) | 41 (46.6%) |
| Total | 344 (67.2%) | 168 (32.8%) |
Housing Structures by Number of Rooms in Bethesda
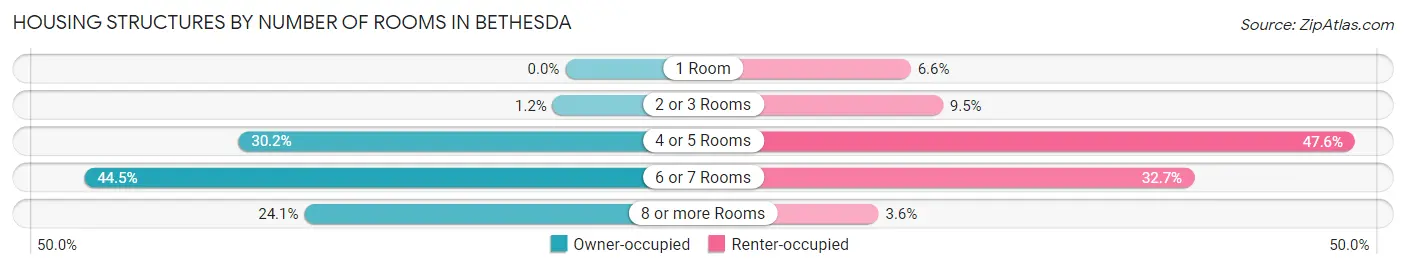
| Number of Rooms | Owner-occupied | Renter-occupied |
| 1 Room | 0 (0.0%) | 11 (6.6%) |
| 2 or 3 Rooms | 4 (1.2%) | 16 (9.5%) |
| 4 or 5 Rooms | 104 (30.2%) | 80 (47.6%) |
| 6 or 7 Rooms | 153 (44.5%) | 55 (32.7%) |
| 8 or more Rooms | 83 (24.1%) | 6 (3.6%) |
| Total | 344 (100.0%) | 168 (100.0%) |
Housing Structure by Heating Type in Bethesda
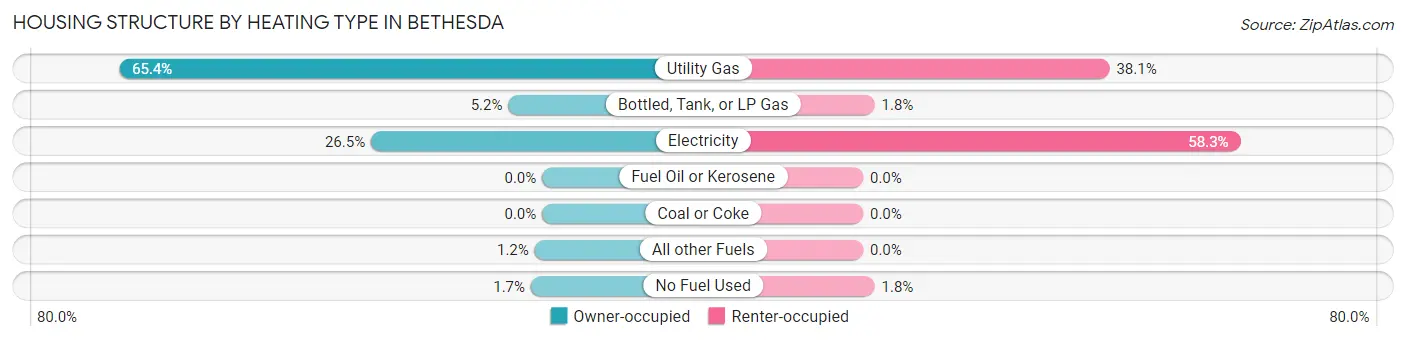
| Heating Type | Owner-occupied | Renter-occupied |
| Utility Gas | 225 (65.4%) | 64 (38.1%) |
| Bottled, Tank, or LP Gas | 18 (5.2%) | 3 (1.8%) |
| Electricity | 91 (26.5%) | 98 (58.3%) |
| Fuel Oil or Kerosene | 0 (0.0%) | 0 (0.0%) |
| Coal or Coke | 0 (0.0%) | 0 (0.0%) |
| All other Fuels | 4 (1.2%) | 0 (0.0%) |
| No Fuel Used | 6 (1.7%) | 3 (1.8%) |
| Total | 344 (100.0%) | 168 (100.0%) |
Household Vehicle Usage in Bethesda
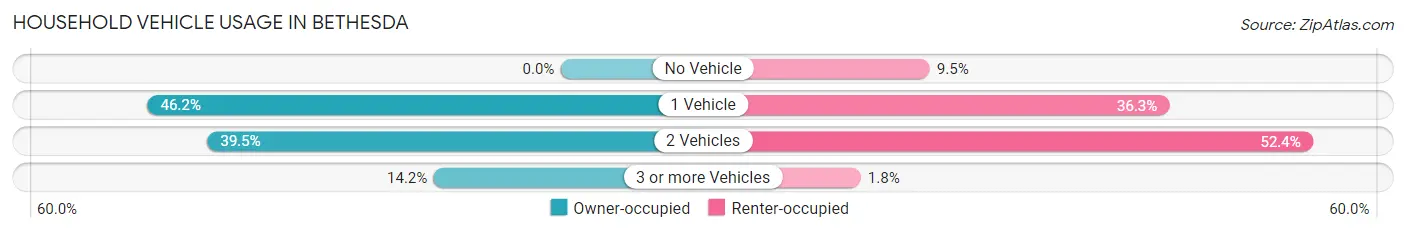
| Vehicles per Household | Owner-occupied | Renter-occupied |
| No Vehicle | 0 (0.0%) | 16 (9.5%) |
| 1 Vehicle | 159 (46.2%) | 61 (36.3%) |
| 2 Vehicles | 136 (39.5%) | 88 (52.4%) |
| 3 or more Vehicles | 49 (14.2%) | 3 (1.8%) |
| Total | 344 (100.0%) | 168 (100.0%) |
Real Estate & Mortgages in Bethesda
Real Estate and Mortgage Overview in Bethesda
| Characteristic | Without Mortgage | With Mortgage |
| Housing Units | 234 | 110 |
| Median Property Value | $111,700 | $114,700 |
| Median Household Income | $34,079 | $7 |
| Monthly Housing Costs | $360 | $0 |
| Real Estate Taxes | $957 | $0 |
Property Value by Mortgage Status in Bethesda
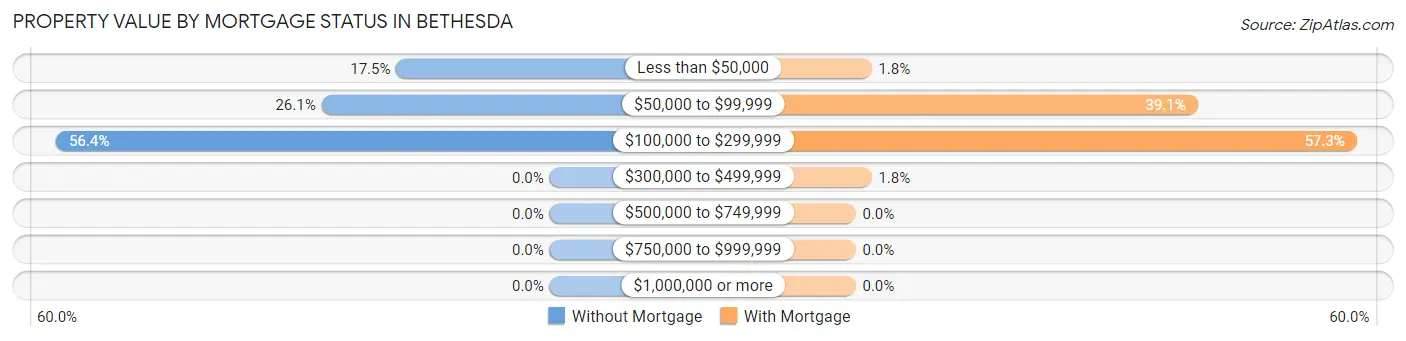
| Property Value | Without Mortgage | With Mortgage |
| Less than $50,000 | 41 (17.5%) | 2 (1.8%) |
| $50,000 to $99,999 | 61 (26.1%) | 43 (39.1%) |
| $100,000 to $299,999 | 132 (56.4%) | 63 (57.3%) |
| $300,000 to $499,999 | 0 (0.0%) | 2 (1.8%) |
| $500,000 to $749,999 | 0 (0.0%) | 0 (0.0%) |
| $750,000 to $999,999 | 0 (0.0%) | 0 (0.0%) |
| $1,000,000 or more | 0 (0.0%) | 0 (0.0%) |
| Total | 234 (100.0%) | 110 (100.0%) |
Household Income by Mortgage Status in Bethesda
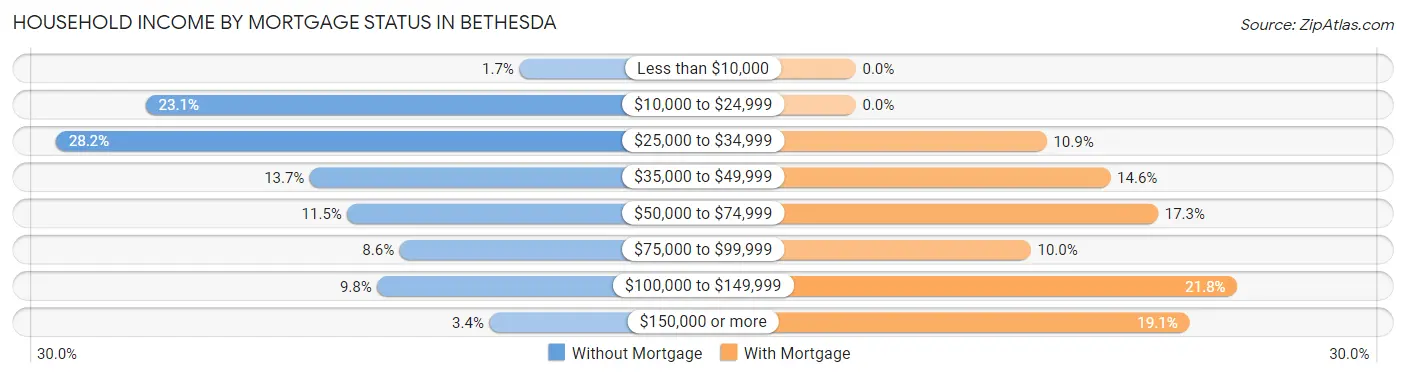
| Household Income | Without Mortgage | With Mortgage |
| Less than $10,000 | 4 (1.7%) | 0 (0.0%) |
| $10,000 to $24,999 | 54 (23.1%) | 0 (0.0%) |
| $25,000 to $34,999 | 66 (28.2%) | 12 (10.9%) |
| $35,000 to $49,999 | 32 (13.7%) | 16 (14.5%) |
| $50,000 to $74,999 | 27 (11.5%) | 19 (17.3%) |
| $75,000 to $99,999 | 20 (8.6%) | 11 (10.0%) |
| $100,000 to $149,999 | 23 (9.8%) | 24 (21.8%) |
| $150,000 or more | 8 (3.4%) | 21 (19.1%) |
| Total | 234 (100.0%) | 110 (100.0%) |
Property Value to Household Income Ratio in Bethesda
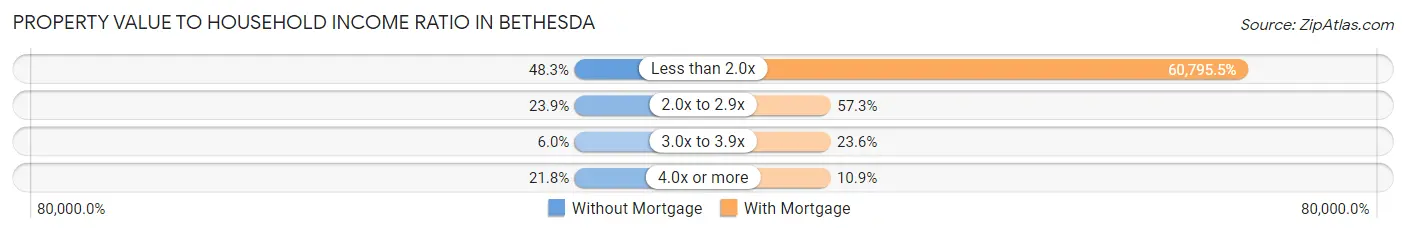
| Value-to-Income Ratio | Without Mortgage | With Mortgage |
| Less than 2.0x | 113 (48.3%) | 66,875 (60,795.5%) |
| 2.0x to 2.9x | 56 (23.9%) | 63 (57.3%) |
| 3.0x to 3.9x | 14 (6.0%) | 26 (23.6%) |
| 4.0x or more | 51 (21.8%) | 12 (10.9%) |
| Total | 234 (100.0%) | 110 (100.0%) |
Real Estate Taxes by Mortgage Status in Bethesda
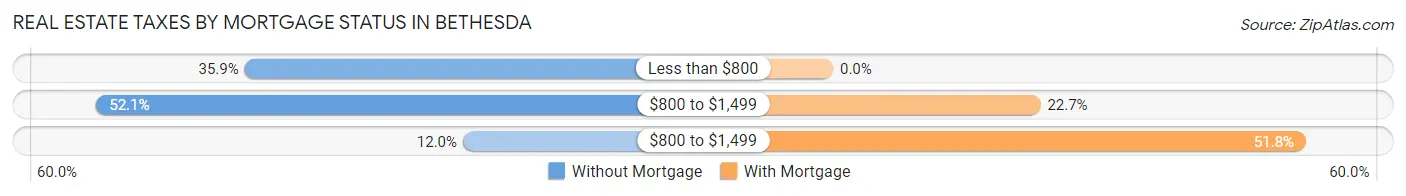
| Property Taxes | Without Mortgage | With Mortgage |
| Less than $800 | 84 (35.9%) | 0 (0.0%) |
| $800 to $1,499 | 122 (52.1%) | 25 (22.7%) |
| $800 to $1,499 | 28 (12.0%) | 57 (51.8%) |
| Total | 234 (100.0%) | 110 (100.0%) |
Health & Disability in Bethesda
Health Insurance Coverage by Age in Bethesda
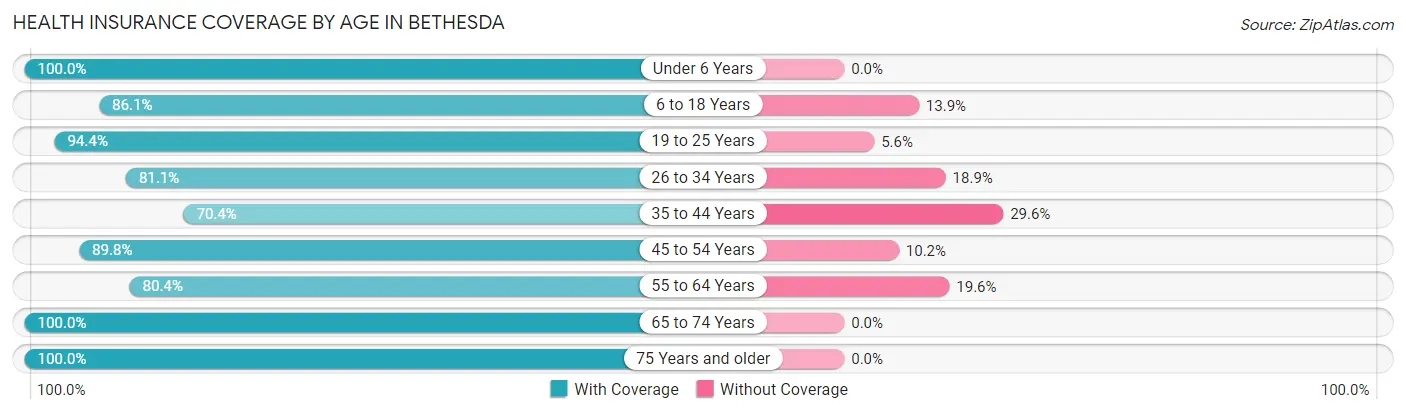
| Age Bracket | With Coverage | Without Coverage |
| Under 6 Years | 134 (100.0%) | 0 (0.0%) |
| 6 to 18 Years | 130 (86.1%) | 21 (13.9%) |
| 19 to 25 Years | 186 (94.4%) | 11 (5.6%) |
| 26 to 34 Years | 133 (81.1%) | 31 (18.9%) |
| 35 to 44 Years | 114 (70.4%) | 48 (29.6%) |
| 45 to 54 Years | 53 (89.8%) | 6 (10.2%) |
| 55 to 64 Years | 119 (80.4%) | 29 (19.6%) |
| 65 to 74 Years | 114 (100.0%) | 0 (0.0%) |
| 75 Years and older | 108 (100.0%) | 0 (0.0%) |
| Total | 1,091 (88.2%) | 146 (11.8%) |
Health Insurance Coverage by Citizenship Status in Bethesda
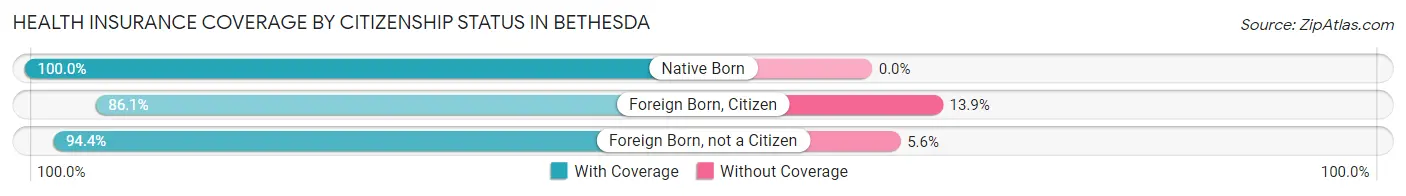
| Citizenship Status | With Coverage | Without Coverage |
| Native Born | 134 (100.0%) | 0 (0.0%) |
| Foreign Born, Citizen | 130 (86.1%) | 21 (13.9%) |
| Foreign Born, not a Citizen | 186 (94.4%) | 11 (5.6%) |
Health Insurance Coverage by Household Income in Bethesda
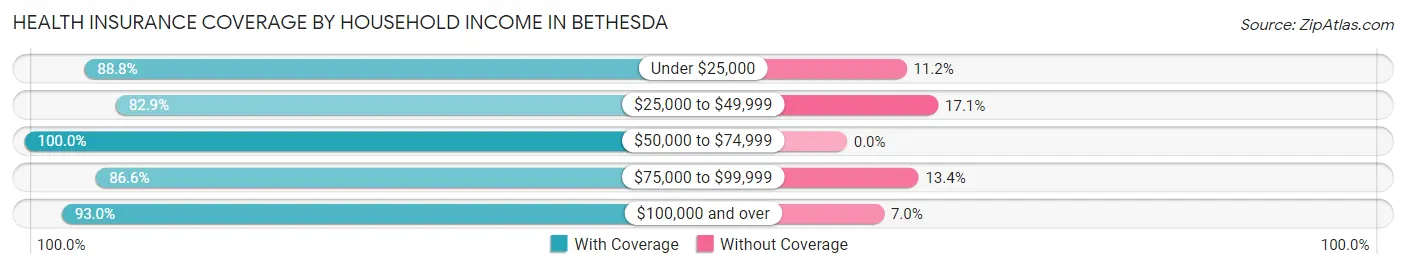
| Household Income | With Coverage | Without Coverage |
| Under $25,000 | 230 (88.8%) | 29 (11.2%) |
| $25,000 to $49,999 | 344 (82.9%) | 71 (17.1%) |
| $50,000 to $74,999 | 103 (100.0%) | 0 (0.0%) |
| $75,000 to $99,999 | 187 (86.6%) | 29 (13.4%) |
| $100,000 and over | 227 (93.0%) | 17 (7.0%) |
Public vs Private Health Insurance Coverage by Age in Bethesda
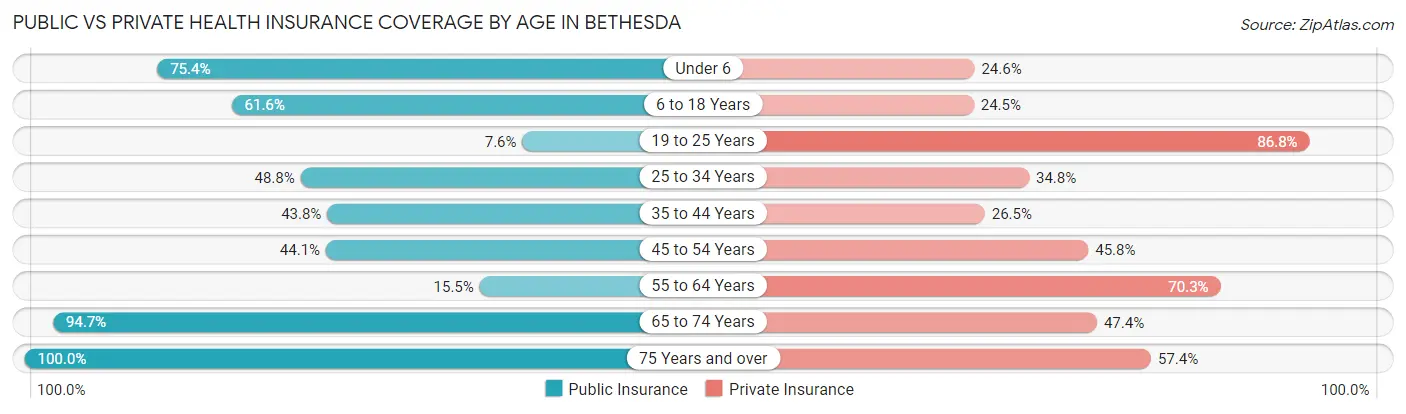
| Age Bracket | Public Insurance | Private Insurance |
| Under 6 | 101 (75.4%) | 33 (24.6%) |
| 6 to 18 Years | 93 (61.6%) | 37 (24.5%) |
| 19 to 25 Years | 15 (7.6%) | 171 (86.8%) |
| 25 to 34 Years | 80 (48.8%) | 57 (34.8%) |
| 35 to 44 Years | 71 (43.8%) | 43 (26.5%) |
| 45 to 54 Years | 26 (44.1%) | 27 (45.8%) |
| 55 to 64 Years | 23 (15.5%) | 104 (70.3%) |
| 65 to 74 Years | 108 (94.7%) | 54 (47.4%) |
| 75 Years and over | 108 (100.0%) | 62 (57.4%) |
| Total | 625 (50.5%) | 588 (47.5%) |
Disability Status by Sex by Age in Bethesda
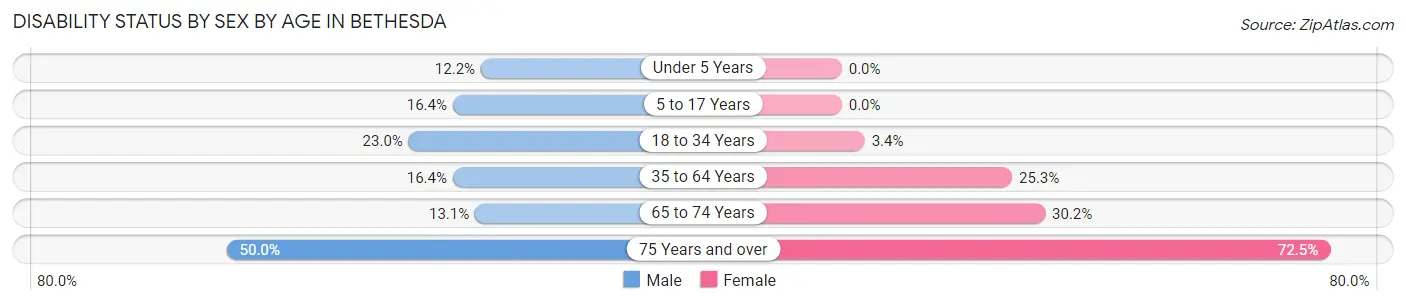
| Age Bracket | Male | Female |
| Under 5 Years | 6 (12.2%) | 0 (0.0%) |
| 5 to 17 Years | 11 (16.4%) | 0 (0.0%) |
| 18 to 34 Years | 51 (23.0%) | 5 (3.4%) |
| 35 to 64 Years | 32 (16.4%) | 44 (25.3%) |
| 65 to 74 Years | 8 (13.1%) | 16 (30.2%) |
| 75 Years and over | 14 (50.0%) | 58 (72.5%) |
Disability Class by Sex by Age in Bethesda
Disability Class: Hearing Difficulty
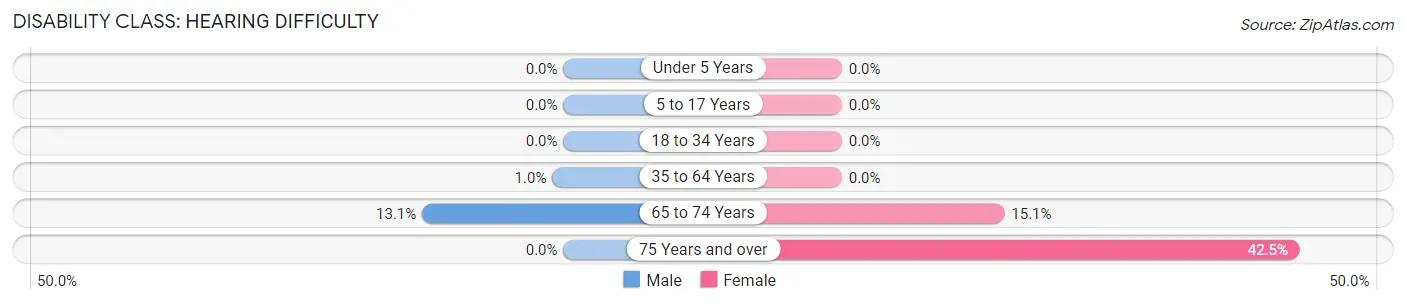
| Age Bracket | Male | Female |
| Under 5 Years | 0 (0.0%) | 0 (0.0%) |
| 5 to 17 Years | 0 (0.0%) | 0 (0.0%) |
| 18 to 34 Years | 0 (0.0%) | 0 (0.0%) |
| 35 to 64 Years | 2 (1.0%) | 0 (0.0%) |
| 65 to 74 Years | 8 (13.1%) | 8 (15.1%) |
| 75 Years and over | 0 (0.0%) | 34 (42.5%) |
Disability Class: Vision Difficulty
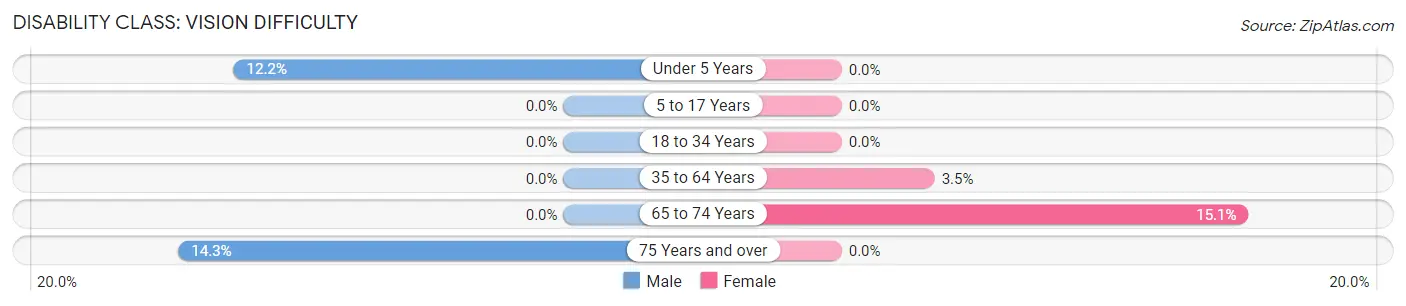
| Age Bracket | Male | Female |
| Under 5 Years | 6 (12.2%) | 0 (0.0%) |
| 5 to 17 Years | 0 (0.0%) | 0 (0.0%) |
| 18 to 34 Years | 0 (0.0%) | 0 (0.0%) |
| 35 to 64 Years | 0 (0.0%) | 6 (3.5%) |
| 65 to 74 Years | 0 (0.0%) | 8 (15.1%) |
| 75 Years and over | 4 (14.3%) | 0 (0.0%) |
Disability Class: Cognitive Difficulty
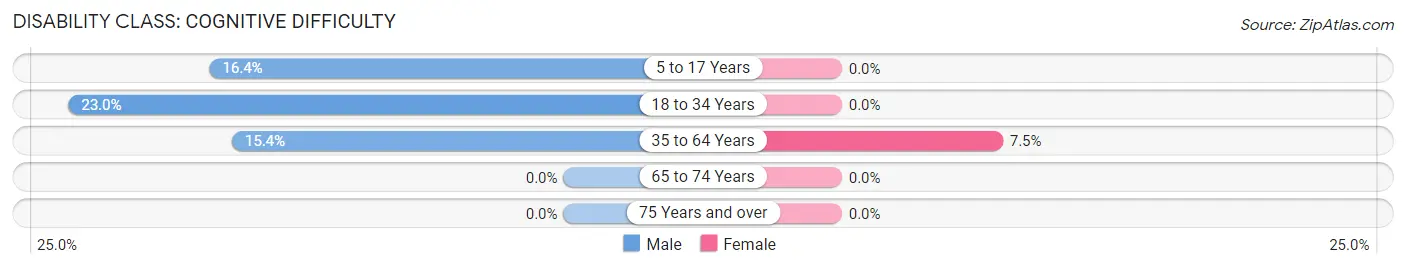
| Age Bracket | Male | Female |
| 5 to 17 Years | 11 (16.4%) | 0 (0.0%) |
| 18 to 34 Years | 51 (23.0%) | 0 (0.0%) |
| 35 to 64 Years | 30 (15.4%) | 13 (7.5%) |
| 65 to 74 Years | 0 (0.0%) | 0 (0.0%) |
| 75 Years and over | 0 (0.0%) | 0 (0.0%) |
Disability Class: Ambulatory Difficulty
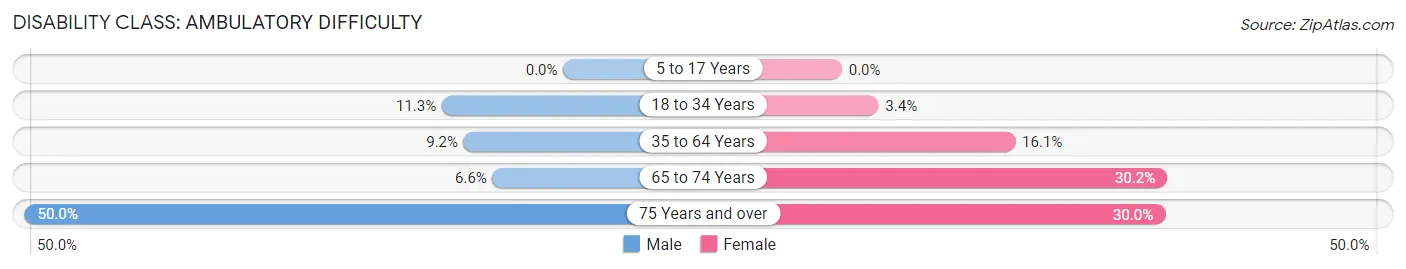
| Age Bracket | Male | Female |
| 5 to 17 Years | 0 (0.0%) | 0 (0.0%) |
| 18 to 34 Years | 25 (11.3%) | 5 (3.4%) |
| 35 to 64 Years | 18 (9.2%) | 28 (16.1%) |
| 65 to 74 Years | 4 (6.6%) | 16 (30.2%) |
| 75 Years and over | 14 (50.0%) | 24 (30.0%) |
Disability Class: Self-Care Difficulty
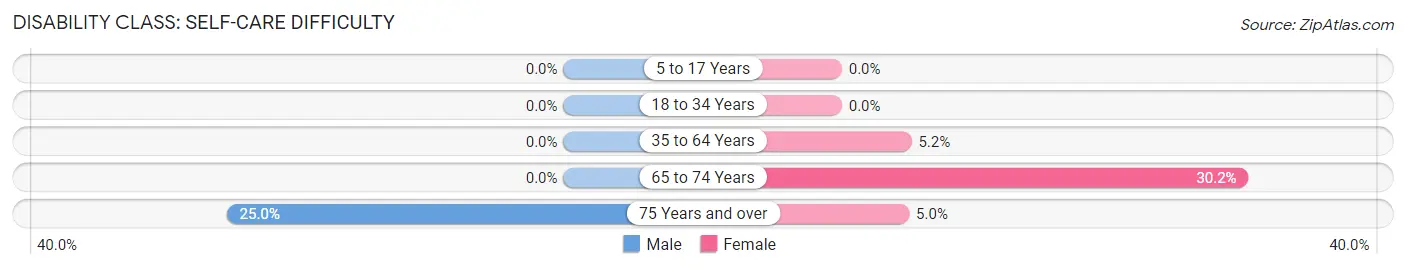
| Age Bracket | Male | Female |
| 5 to 17 Years | 0 (0.0%) | 0 (0.0%) |
| 18 to 34 Years | 0 (0.0%) | 0 (0.0%) |
| 35 to 64 Years | 0 (0.0%) | 9 (5.2%) |
| 65 to 74 Years | 0 (0.0%) | 16 (30.2%) |
| 75 Years and over | 7 (25.0%) | 4 (5.0%) |
Technology Access in Bethesda
Computing Device Access in Bethesda
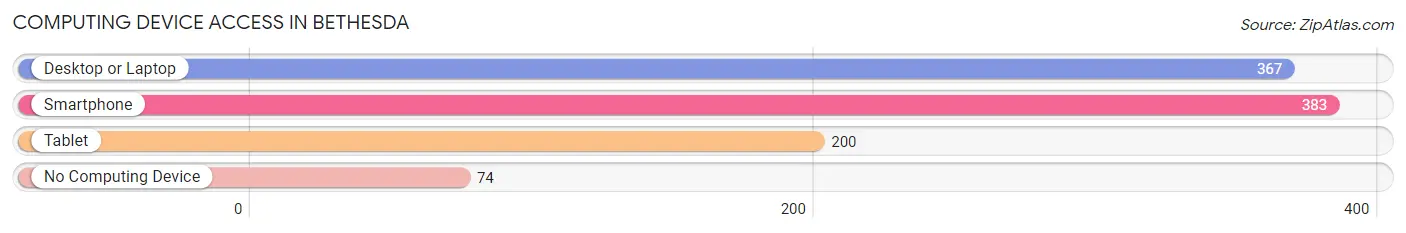
| Device Type | # Households | % Households |
| Desktop or Laptop | 367 | 71.7% |
| Smartphone | 383 | 74.8% |
| Tablet | 200 | 39.1% |
| No Computing Device | 74 | 14.4% |
| Total | 512 | 100.0% |
Internet Access in Bethesda
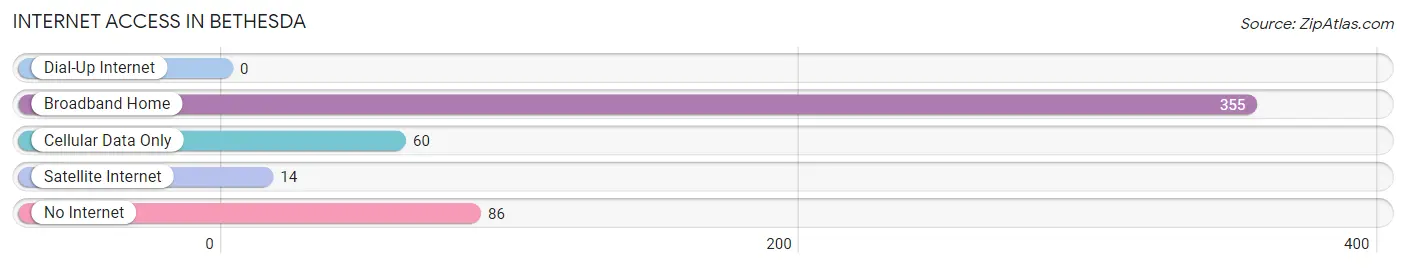
| Internet Type | # Households | % Households |
| Dial-Up Internet | 0 | 0.0% |
| Broadband Home | 355 | 69.3% |
| Cellular Data Only | 60 | 11.7% |
| Satellite Internet | 14 | 2.7% |
| No Internet | 86 | 16.8% |
| Total | 512 | 100.0% |
Bethesda Summary
Bethesda is a small village located in Belmont County, Ohio. It is situated on the Ohio River, approximately 25 miles west of Wheeling, West Virginia. The village has a population of approximately 1,000 people and is part of the Wheeling, West Virginia Metropolitan Statistical Area.
Geography
Bethesda is located in Belmont County, Ohio, on the Ohio River. It is situated on the north side of the river, approximately 25 miles west of Wheeling, West Virginia. The village is located in the Appalachian Plateau region of the Appalachian Mountains. The terrain is mostly hilly and forested, with some flat areas along the river. The climate is humid continental, with hot summers and cold winters.
History
Bethesda was founded in 1817 by a group of settlers from Pennsylvania. The village was named after the Bethesda Presbyterian Church, which was established in the area in 1818. The village grew slowly over the years, and by the mid-19th century, it had become a thriving river port. The village was incorporated in 1867.
In the late 19th century, Bethesda was a major center for the coal and oil industries. The village was home to several coal mines, oil refineries, and other related businesses. The village also had a large number of saloons and other businesses catering to the miners and oil workers.
In the early 20th century, Bethesda began to decline as the coal and oil industries moved away. The village was hit hard by the Great Depression, and many of the businesses closed. The village was also affected by the construction of the Ohio River dams, which caused flooding in the area.
Economy
Today, Bethesda’s economy is largely based on tourism and agriculture. The village is home to several wineries, and it is a popular destination for wine tours. The village also has several antique shops, art galleries, and other tourist attractions.
Agriculture is also an important part of the local economy. The village is home to several farms, and the surrounding area is known for its production of corn, soybeans, and other crops.
Demographics
As of the 2010 census, Bethesda had a population of 1,000 people. The racial makeup of the village was 97.2% White, 0.7% African American, 0.2% Native American, 0.2% Asian, 0.2% from other races, and 1.7% from two or more races. Hispanic or Latino of any race were 0.7% of the population.
The median household income in Bethesda was $37,500, and the median family income was $45,000. The per capita income was $19,000. About 11.2% of families and 14.2% of the population were below the poverty line, including 18.2% of those under age 18 and 8.2% of those age 65 or over.
Conclusion
Bethesda is a small village located in Belmont County, Ohio. It is situated on the Ohio River, approximately 25 miles west of Wheeling, West Virginia. The village has a population of approximately 1,000 people and is part of the Wheeling, West Virginia Metropolitan Statistical Area. Bethesda’s economy is largely based on tourism and agriculture, and the village is home to several wineries, antique shops, art galleries, and other tourist attractions. The village also has several farms, and the surrounding area is known for its production of corn, soybeans, and other crops. The racial makeup of the village is mostly White, with a small percentage of African American, Native American, Asian, and other races. The median household income in Bethesda is $37,500, and the median family income is $45,000.
Common Questions
What is Per Capita Income in Bethesda?
Per Capita income in Bethesda is $24,243.
What is the Median Family Income in Bethesda?
Median Family Income in Bethesda is $48,438.
What is the Median Household income in Bethesda?
Median Household Income in Bethesda is $37,000.
What is Income or Wage Gap in Bethesda?
Income or Wage Gap in Bethesda is 0.4%.
Women in Bethesda earn 99.6 cents for every dollar earned by a man.
What is Inequality or Gini Index in Bethesda?
Inequality or Gini Index in Bethesda is 0.46.
What is the Total Population of Bethesda?
Total Population of Bethesda is 1,237.
What is the Total Male Population of Bethesda?
Total Male Population of Bethesda is 622.
What is the Total Female Population of Bethesda?
Total Female Population of Bethesda is 615.
What is the Ratio of Males per 100 Females in Bethesda?
There are 101.14 Males per 100 Females in Bethesda.
What is the Ratio of Females per 100 Males in Bethesda?
There are 98.87 Females per 100 Males in Bethesda.
What is the Median Population Age in Bethesda?
Median Population Age in Bethesda is 31.6 Years.
What is the Average Family Size in Bethesda
Average Family Size in Bethesda is 3.3 People.
What is the Average Household Size in Bethesda
Average Household Size in Bethesda is 2.4 People.
How Large is the Labor Force in Bethesda?
There are 548 People in the Labor Forcein in Bethesda.
What is the Percentage of People in the Labor Force in Bethesda?
53.9% of People are in the Labor Force in Bethesda.
What is the Unemployment Rate in Bethesda?
Unemployment Rate in Bethesda is 5.5%.