Hayesville, OH Map & Demographics
Hayesville Map
Hayesville Overview
$28,009
PER CAPITA INCOME
$76,607
AVG FAMILY INCOME
$73,125
AVG HOUSEHOLD INCOME
35.7%
WAGE / INCOME GAP [ % ]
64.3¢/ $1
WAGE / INCOME GAP [ $ ]
0.35
INEQUALITY / GINI INDEX
599
TOTAL POPULATION
255
MALE POPULATION
344
FEMALE POPULATION
74.13
MALES / 100 FEMALES
134.90
FEMALES / 100 MALES
37.1
MEDIAN AGE
2.7
AVG FAMILY SIZE
2.4
AVG HOUSEHOLD SIZE
294
LABOR FORCE [ PEOPLE ]
64.3%
PERCENT IN LABOR FORCE
3.4%
UNEMPLOYMENT RATE
Hayesville Zip Codes
Hayesville Area Codes
Income in Hayesville
Income Overview in Hayesville
Per Capita Income in Hayesville is $28,009, while median incomes of families and households are $76,607 and $73,125 respectively.
| Characteristic | Number | Measure |
| Per Capita Income | 599 | $28,009 |
| Median Family Income | 192 | $76,607 |
| Mean Family Income | 192 | $76,510 |
| Median Household Income | 246 | $73,125 |
| Mean Household Income | 246 | $69,120 |
| Income Deficit | 192 | $0 |
| Wage / Income Gap (%) | 599 | 35.69% |
| Wage / Income Gap ($) | 599 | 64.31¢ per $1 |
| Gini / Inequality Index | 599 | 0.35 |
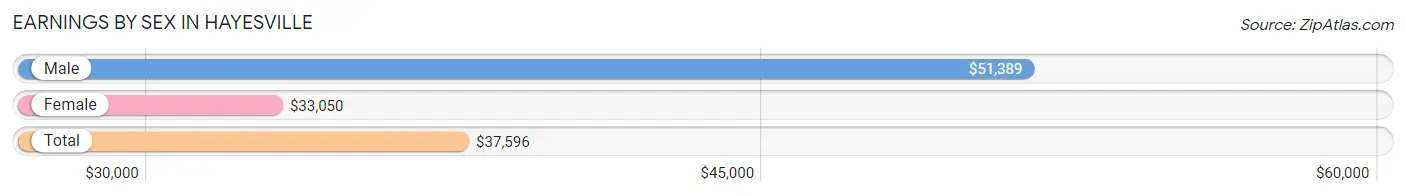
Earnings by Sex in Hayesville
Average Earnings in Hayesville are $37,596, $51,389 for men and $33,050 for women, a difference of 35.7%.
| Sex | Number | Average Earnings |
| Male | 160 (52.5%) | $51,389 |
| Female | 145 (47.5%) | $33,050 |
| Total | 305 (100.0%) | $37,596 |
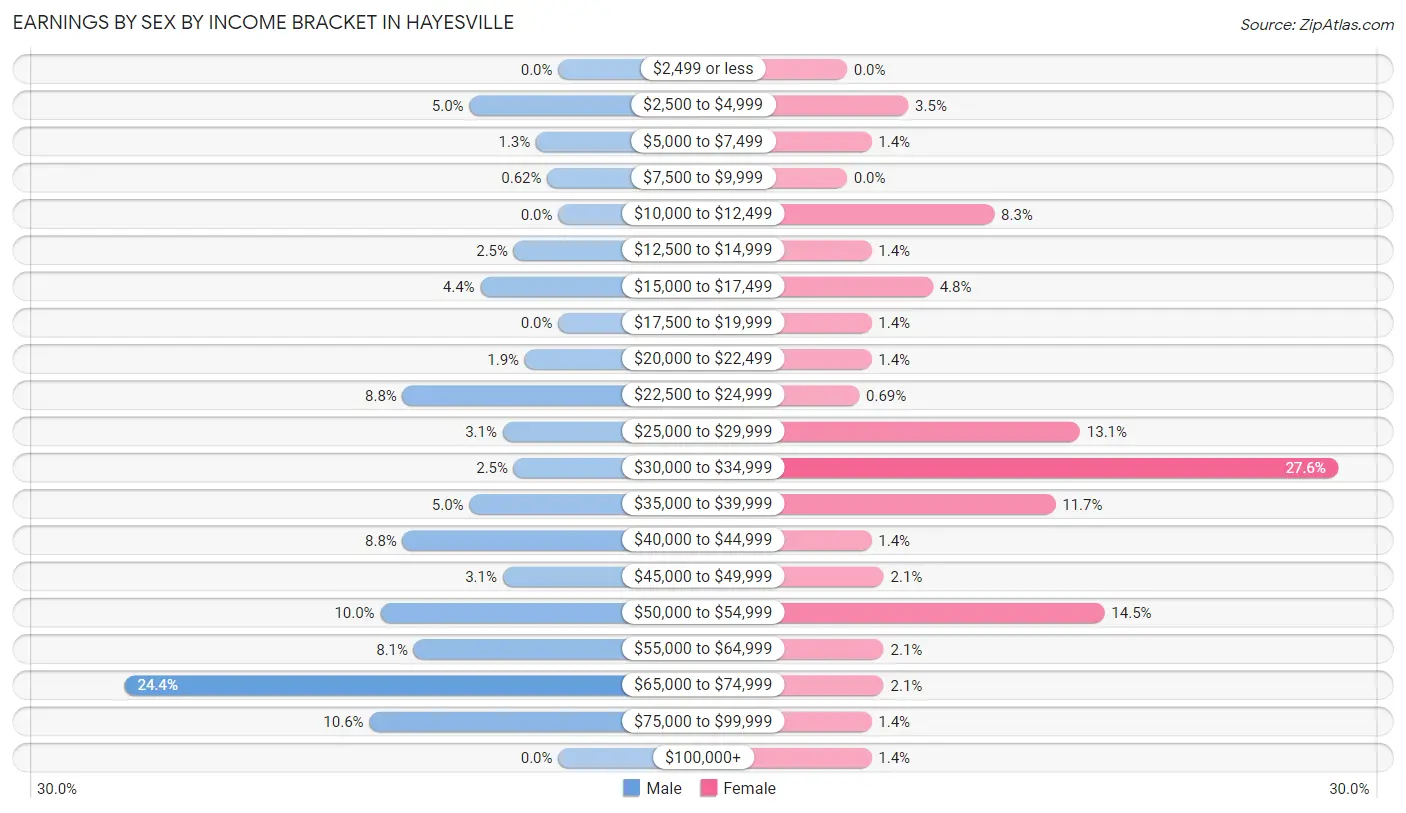
Earnings by Sex by Income Bracket in Hayesville
The most common earnings brackets in Hayesville are $65,000 to $74,999 for men (39 | 24.4%) and $30,000 to $34,999 for women (40 | 27.6%).
| Income | Male | Female |
| $2,499 or less | 0 (0.0%) | 0 (0.0%) |
| $2,500 to $4,999 | 8 (5.0%) | 5 (3.5%) |
| $5,000 to $7,499 | 2 (1.3%) | 2 (1.4%) |
| $7,500 to $9,999 | 1 (0.6%) | 0 (0.0%) |
| $10,000 to $12,499 | 0 (0.0%) | 12 (8.3%) |
| $12,500 to $14,999 | 4 (2.5%) | 2 (1.4%) |
| $15,000 to $17,499 | 7 (4.4%) | 7 (4.8%) |
| $17,500 to $19,999 | 0 (0.0%) | 2 (1.4%) |
| $20,000 to $22,499 | 3 (1.9%) | 2 (1.4%) |
| $22,500 to $24,999 | 14 (8.7%) | 1 (0.7%) |
| $25,000 to $29,999 | 5 (3.1%) | 19 (13.1%) |
| $30,000 to $34,999 | 4 (2.5%) | 40 (27.6%) |
| $35,000 to $39,999 | 8 (5.0%) | 17 (11.7%) |
| $40,000 to $44,999 | 14 (8.7%) | 2 (1.4%) |
| $45,000 to $49,999 | 5 (3.1%) | 3 (2.1%) |
| $50,000 to $54,999 | 16 (10.0%) | 21 (14.5%) |
| $55,000 to $64,999 | 13 (8.1%) | 3 (2.1%) |
| $65,000 to $74,999 | 39 (24.4%) | 3 (2.1%) |
| $75,000 to $99,999 | 17 (10.6%) | 2 (1.4%) |
| $100,000+ | 0 (0.0%) | 2 (1.4%) |
| Total | 160 (100.0%) | 145 (100.0%) |
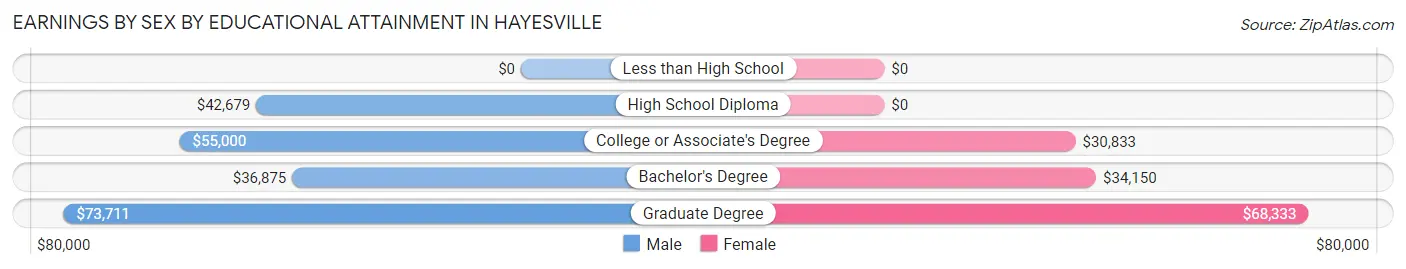
Earnings by Sex by Educational Attainment in Hayesville
Average earnings in Hayesville are $53,438 for men and $33,100 for women, a difference of 38.1%. Men with an educational attainment of graduate degree enjoy the highest average annual earnings of $73,711, while those with bachelor's degree education earn the least with $36,875. Women with an educational attainment of graduate degree earn the most with the average annual earnings of $68,333, while those with college or associate's degree education have the smallest earnings of $30,833.
| Educational Attainment | Male Income | Female Income |
| Less than High School | - | - |
| High School Diploma | $42,679 | $0 |
| College or Associate's Degree | $55,000 | $30,833 |
| Bachelor's Degree | $36,875 | $34,150 |
| Graduate Degree | $73,711 | $68,333 |
| Total | $53,438 | $33,100 |
Family Income in Hayesville
Family Income Brackets in Hayesville
According to the Hayesville family income data, there are 56 families falling into the $100,000 to $149,999 income range, which is the most common income bracket and makes up 29.2% of all families. Conversely, the $10,000 to $14,999 income bracket is the least frequent group with only 2 families (1.0%) belonging to this category.
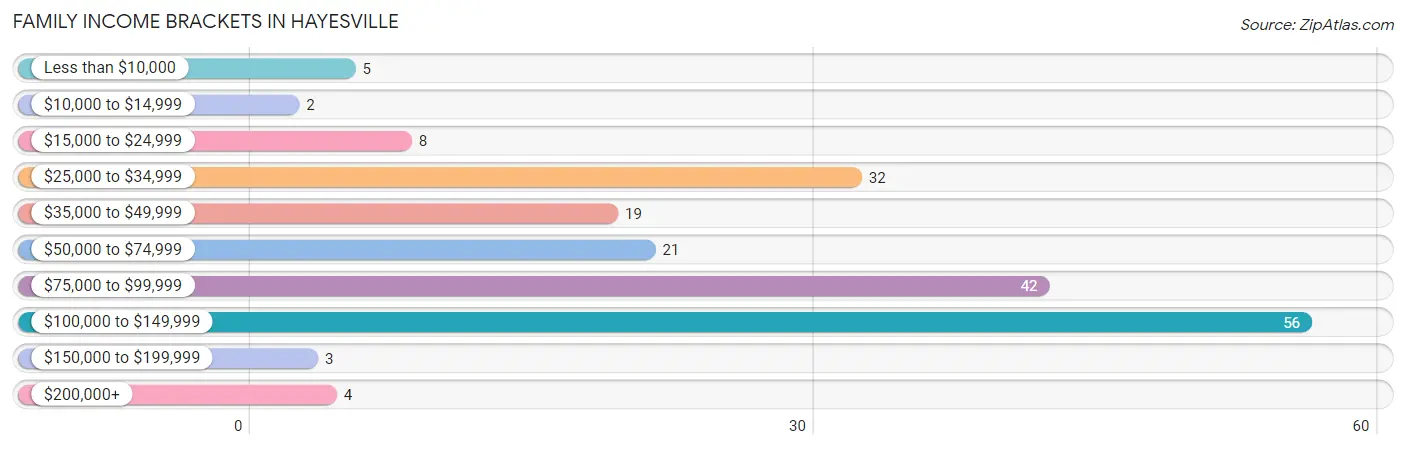
| Income Bracket | # Families | % Families |
| Less than $10,000 | 5 | 2.6% |
| $10,000 to $14,999 | 2 | 1.0% |
| $15,000 to $24,999 | 8 | 4.2% |
| $25,000 to $34,999 | 32 | 16.7% |
| $35,000 to $49,999 | 19 | 9.9% |
| $50,000 to $74,999 | 21 | 10.9% |
| $75,000 to $99,999 | 42 | 21.9% |
| $100,000 to $149,999 | 56 | 29.2% |
| $150,000 to $199,999 | 3 | 1.6% |
| $200,000+ | 4 | 2.1% |
Family Income by Famaliy Size in Hayesville
2-person families (121 | 63.0%) account for the highest median family income in Hayesville with $76,875 per family, while 2-person families (121 | 63.0%) have the highest median income of $38,438 per family member.
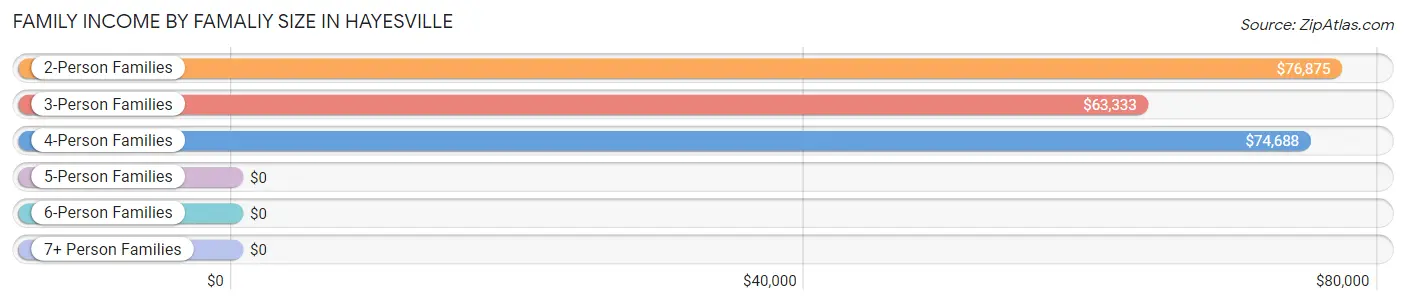
| Income Bracket | # Families | Median Income |
| 2-Person Families | 121 (63.0%) | $76,875 |
| 3-Person Families | 34 (17.7%) | $63,333 |
| 4-Person Families | 15 (7.8%) | $74,688 |
| 5-Person Families | 13 (6.8%) | $0 |
| 6-Person Families | 9 (4.7%) | $0 |
| 7+ Person Families | 0 (0.0%) | $0 |
| Total | 192 (100.0%) | $76,607 |
Family Income by Number of Earners in Hayesville
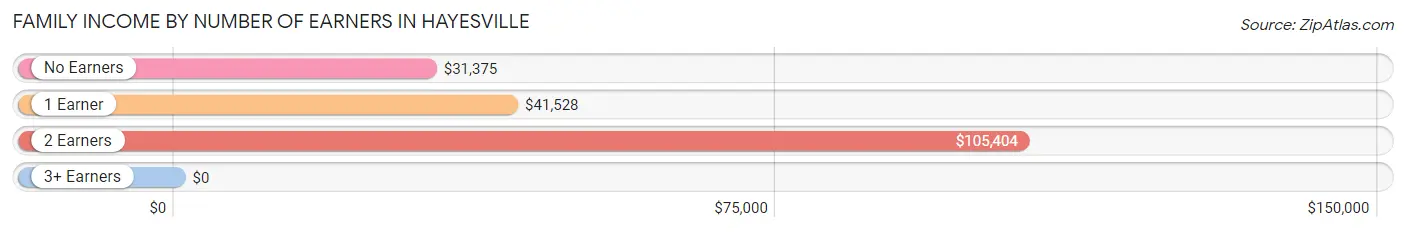
| Number of Earners | # Families | Median Income |
| No Earners | 38 (19.8%) | $31,375 |
| 1 Earner | 49 (25.5%) | $41,528 |
| 2 Earners | 101 (52.6%) | $105,404 |
| 3+ Earners | 4 (2.1%) | $0 |
| Total | 192 (100.0%) | $76,607 |
Household Income in Hayesville
Household Income Brackets in Hayesville
With 59 households falling in the category, the $100,000 to $149,999 income range is the most frequent in Hayesville, accounting for 24.0% of all households. In contrast, only 3 households (1.2%) fall into the $10,000 to $14,999 income bracket, making it the least populous group.
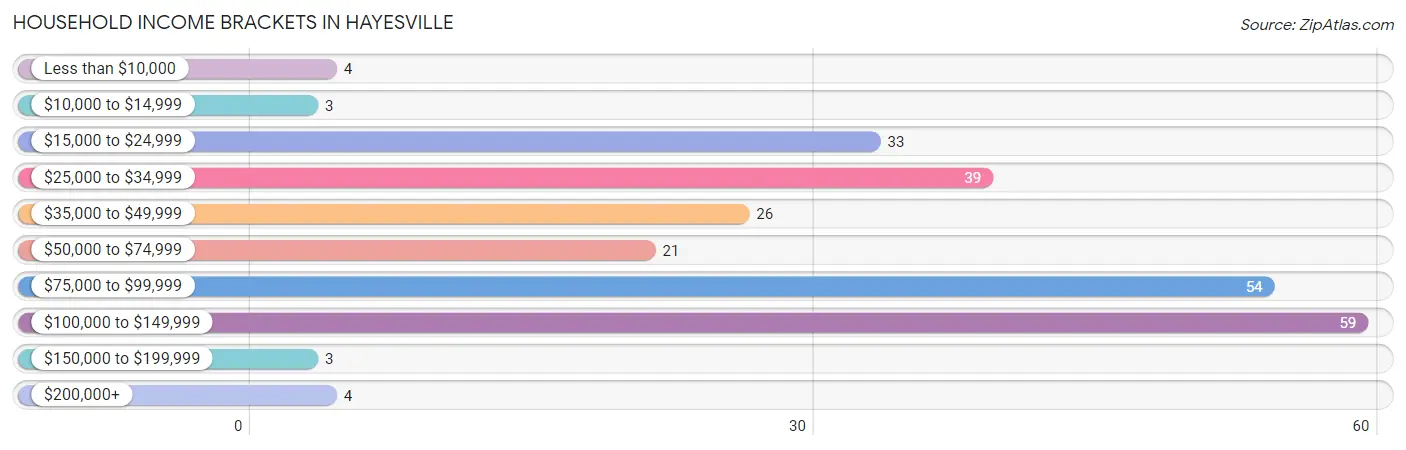
| Income Bracket | # Households | % Households |
| Less than $10,000 | 4 | 1.6% |
| $10,000 to $14,999 | 3 | 1.2% |
| $15,000 to $24,999 | 33 | 13.4% |
| $25,000 to $34,999 | 39 | 15.9% |
| $35,000 to $49,999 | 26 | 10.6% |
| $50,000 to $74,999 | 21 | 8.5% |
| $75,000 to $99,999 | 54 | 22.0% |
| $100,000 to $149,999 | 59 | 24.0% |
| $150,000 to $199,999 | 3 | 1.2% |
| $200,000+ | 4 | 1.6% |
Household Income by Householder Age in Hayesville
The median household income in Hayesville is $73,125, with the highest median household income of $90,833 found in the 25 to 44 years age bracket for the primary householder. A total of 120 households (48.8%) fall into this category. Meanwhile, the 15 to 24 years age bracket for the primary householder has the lowest median household income of $0, with 7 households (2.9%) in this group.
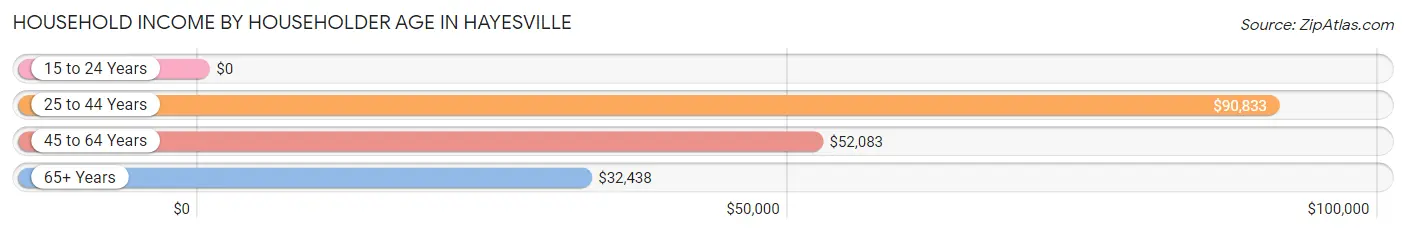
| Income Bracket | # Households | Median Income |
| 15 to 24 Years | 7 (2.9%) | $0 |
| 25 to 44 Years | 120 (48.8%) | $90,833 |
| 45 to 64 Years | 40 (16.3%) | $52,083 |
| 65+ Years | 79 (32.1%) | $32,438 |
| Total | 246 (100.0%) | $73,125 |
Poverty in Hayesville
Income Below Poverty by Sex and Age in Hayesville
With 6.3% poverty level for males and 9.3% for females among the residents of Hayesville, 15 year old males and 45 to 54 year old females are the most vulnerable to poverty, with 4 males (100.0%) and 7 females (58.3%) in their respective age groups living below the poverty level.
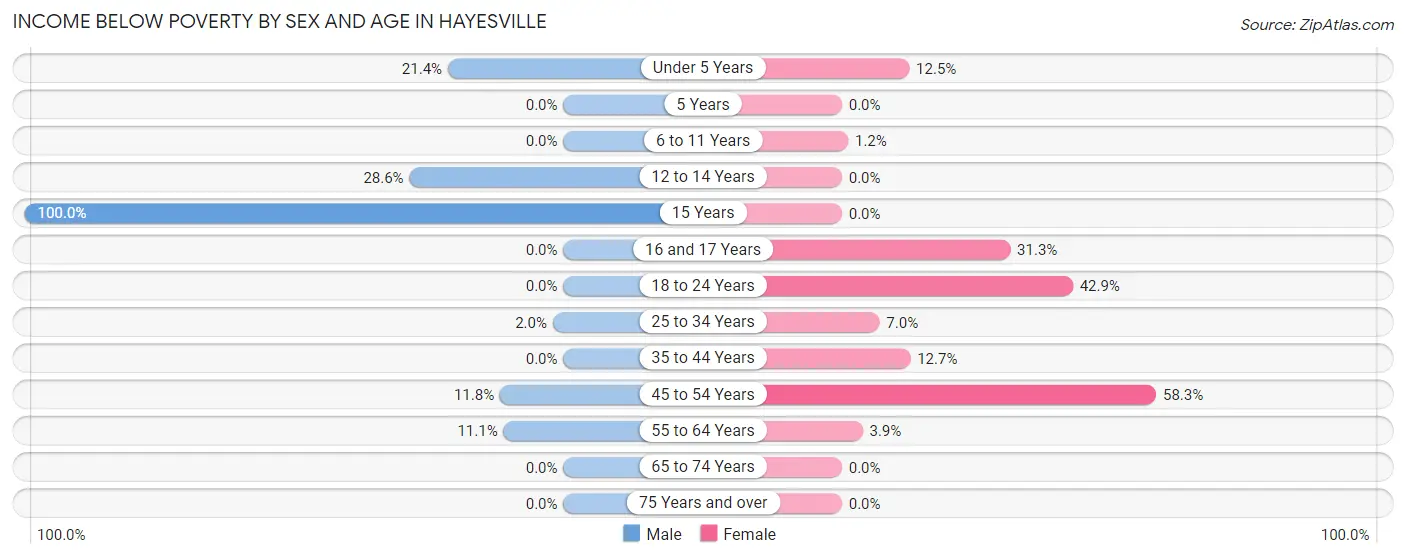
| Age Bracket | Male | Female |
| Under 5 Years | 3 (21.4%) | 1 (12.5%) |
| 5 Years | 0 (0.0%) | 0 (0.0%) |
| 6 to 11 Years | 0 (0.0%) | 1 (1.2%) |
| 12 to 14 Years | 4 (28.6%) | 0 (0.0%) |
| 15 Years | 4 (100.0%) | 0 (0.0%) |
| 16 and 17 Years | 0 (0.0%) | 5 (31.2%) |
| 18 to 24 Years | 0 (0.0%) | 6 (42.9%) |
| 25 to 34 Years | 1 (2.0%) | 3 (7.0%) |
| 35 to 44 Years | 0 (0.0%) | 8 (12.7%) |
| 45 to 54 Years | 2 (11.8%) | 7 (58.3%) |
| 55 to 64 Years | 2 (11.1%) | 1 (3.8%) |
| 65 to 74 Years | 0 (0.0%) | 0 (0.0%) |
| 75 Years and over | 0 (0.0%) | 0 (0.0%) |
| Total | 16 (6.3%) | 32 (9.3%) |
Income Above Poverty by Sex and Age in Hayesville
According to the poverty statistics in Hayesville, males aged 6 to 11 years and females aged 12 to 14 years are the age groups that are most secure financially, with 100.0% of males and 100.0% of females in these age groups living above the poverty line.
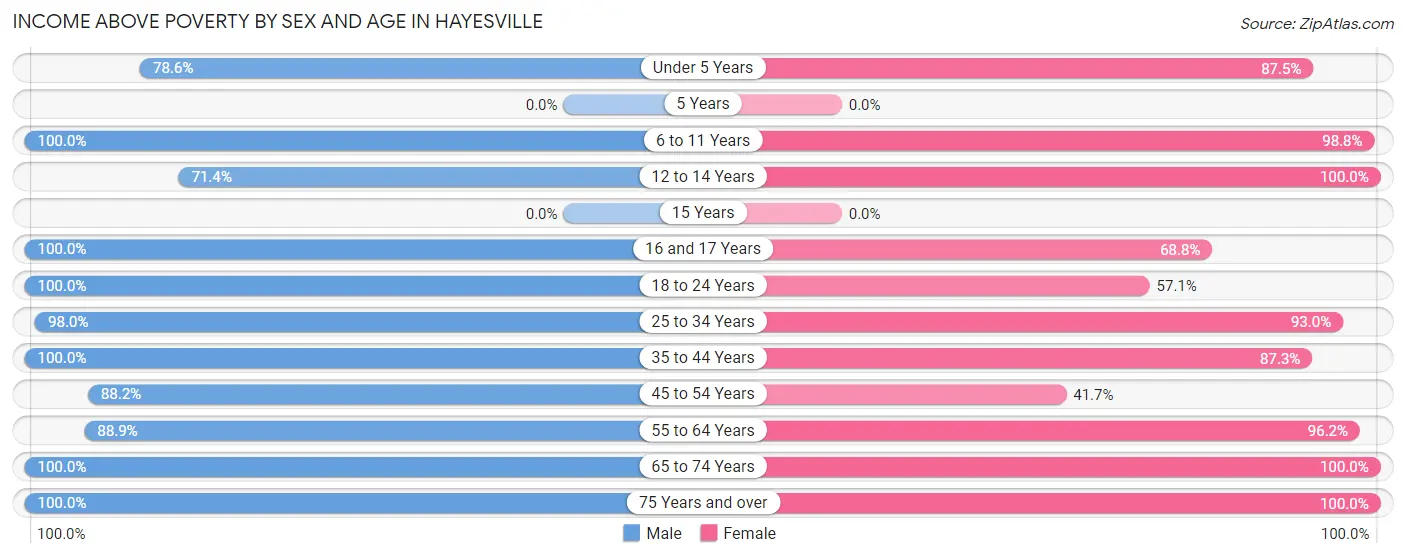
| Age Bracket | Male | Female |
| Under 5 Years | 11 (78.6%) | 7 (87.5%) |
| 5 Years | 0 (0.0%) | 0 (0.0%) |
| 6 to 11 Years | 13 (100.0%) | 85 (98.8%) |
| 12 to 14 Years | 10 (71.4%) | 3 (100.0%) |
| 15 Years | 0 (0.0%) | 0 (0.0%) |
| 16 and 17 Years | 4 (100.0%) | 11 (68.8%) |
| 18 to 24 Years | 13 (100.0%) | 8 (57.1%) |
| 25 to 34 Years | 50 (98.0%) | 40 (93.0%) |
| 35 to 44 Years | 64 (100.0%) | 55 (87.3%) |
| 45 to 54 Years | 15 (88.2%) | 5 (41.7%) |
| 55 to 64 Years | 16 (88.9%) | 25 (96.2%) |
| 65 to 74 Years | 13 (100.0%) | 56 (100.0%) |
| 75 Years and over | 30 (100.0%) | 17 (100.0%) |
| Total | 239 (93.7%) | 312 (90.7%) |
Income Below Poverty Among Married-Couple Families in Hayesville
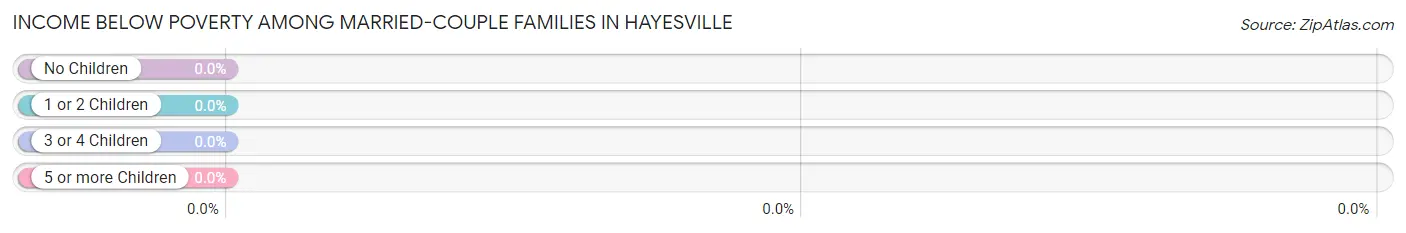
| Children | Above Poverty | Below Poverty |
| No Children | 101 (100.0%) | 0 (0.0%) |
| 1 or 2 Children | 32 (100.0%) | 0 (0.0%) |
| 3 or 4 Children | 22 (100.0%) | 0 (0.0%) |
| 5 or more Children | 0 (0.0%) | 0 (0.0%) |
| Total | 155 (100.0%) | 0 (0.0%) |
Income Below Poverty Among Single-Parent Households in Hayesville
According to the poverty data in Hayesville, 9.1% or 1 single-father households and 53.8% or 14 single-mother households are living below the poverty line. Among single-father households, those with 3 or 4 children have the highest poverty rate, with 1 households (100.0%) experiencing poverty. Likewise, among single-mother households, those with 1 or 2 children have the highest poverty rate, with 10 households (100.0%) falling below the poverty line.
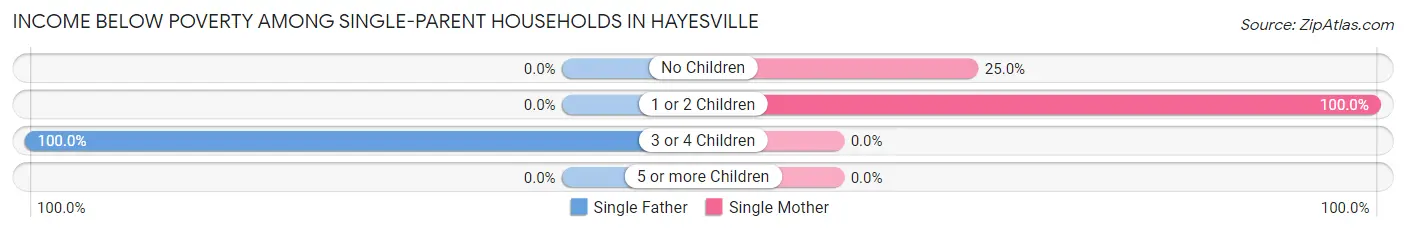
| Children | Single Father | Single Mother |
| No Children | 0 (0.0%) | 4 (25.0%) |
| 1 or 2 Children | 0 (0.0%) | 10 (100.0%) |
| 3 or 4 Children | 1 (100.0%) | 0 (0.0%) |
| 5 or more Children | 0 (0.0%) | 0 (0.0%) |
| Total | 1 (9.1%) | 14 (53.8%) |
Income Below Poverty Among Married-Couple vs Single-Parent Households in Hayesville
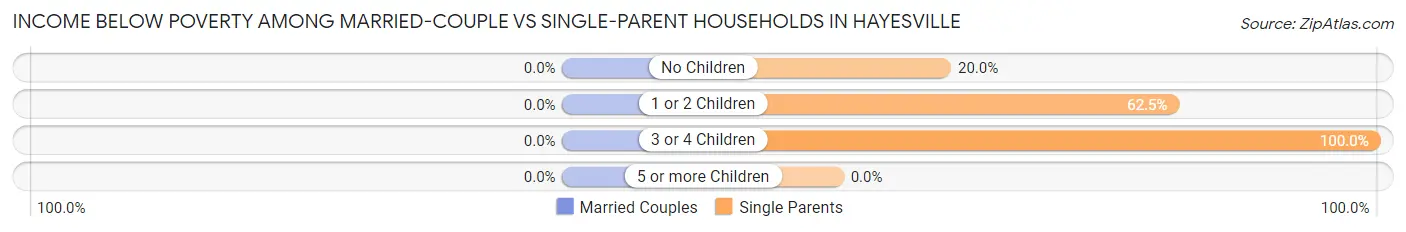
| Children | Married-Couple Families | Single-Parent Households |
| No Children | 0 (0.0%) | 4 (20.0%) |
| 1 or 2 Children | 0 (0.0%) | 10 (62.5%) |
| 3 or 4 Children | 0 (0.0%) | 1 (100.0%) |
| 5 or more Children | 0 (0.0%) | 0 (0.0%) |
| Total | 0 (0.0%) | 15 (40.5%) |
Race in Hayesville
The most populous races in Hayesville are White / Caucasian (590 | 98.5%), Hispanic or Latino (16 | 2.7%), and Black / African American (5 | 0.8%).
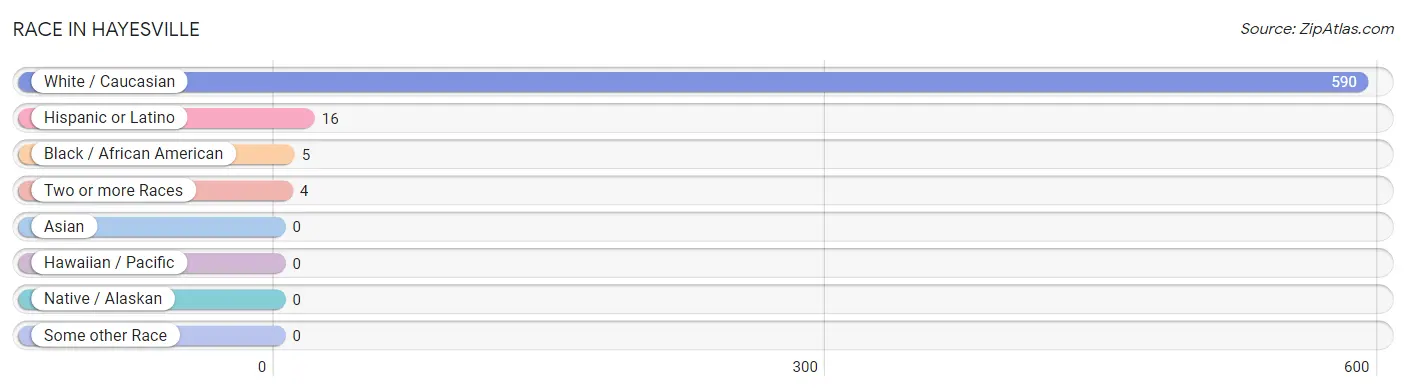
| Race | # Population | % Population |
| Asian | 0 | 0.0% |
| Black / African American | 5 | 0.8% |
| Hawaiian / Pacific | 0 | 0.0% |
| Hispanic or Latino | 16 | 2.7% |
| Native / Alaskan | 0 | 0.0% |
| White / Caucasian | 590 | 98.5% |
| Two or more Races | 4 | 0.7% |
| Some other Race | 0 | 0.0% |
| Total | 599 | 100.0% |
Ancestry in Hayesville
The most populous ancestries reported in Hayesville are German (248 | 41.4%), English (61 | 10.2%), Scottish (43 | 7.2%), Irish (35 | 5.8%), and American (34 | 5.7%), together accounting for 70.3% of all Hayesville residents.
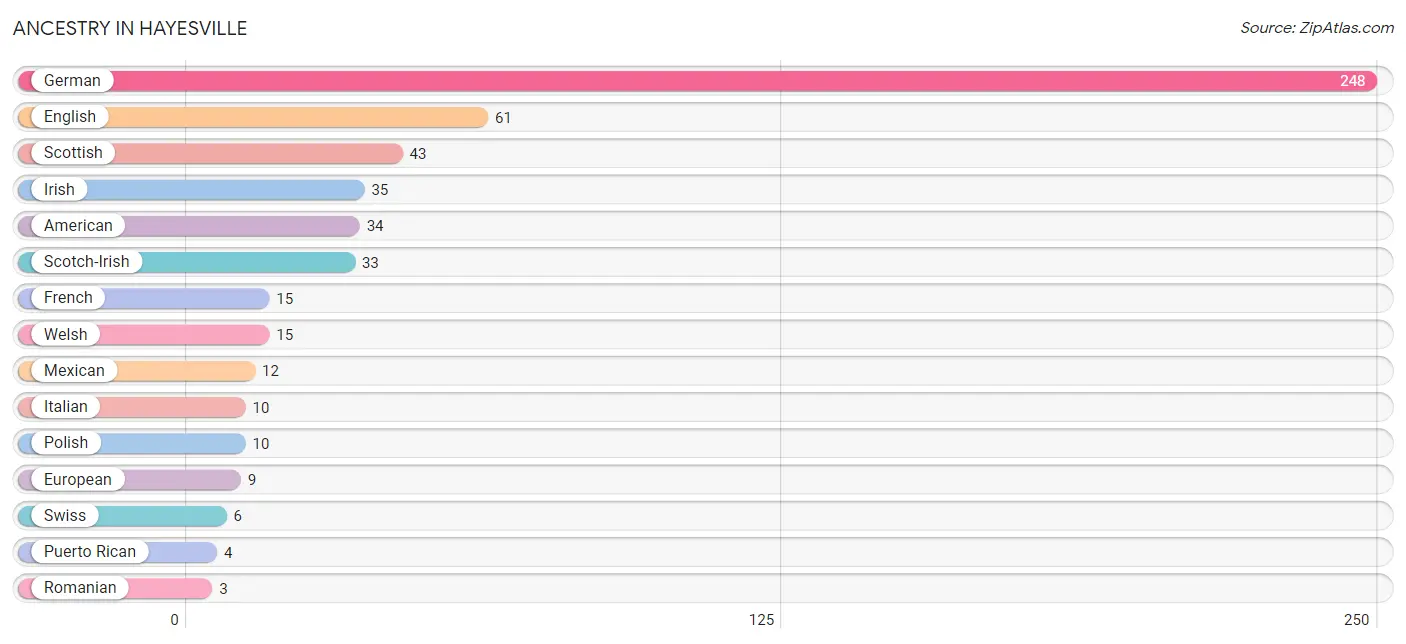
| Ancestry | # Population | % Population |
| American | 34 | 5.7% |
| British | 2 | 0.3% |
| Cherokee | 1 | 0.2% |
| Dutch | 1 | 0.2% |
| English | 61 | 10.2% |
| European | 9 | 1.5% |
| French | 15 | 2.5% |
| German | 248 | 41.4% |
| Irish | 35 | 5.8% |
| Italian | 10 | 1.7% |
| Macedonian | 2 | 0.3% |
| Mexican | 12 | 2.0% |
| Polish | 10 | 1.7% |
| Puerto Rican | 4 | 0.7% |
| Romanian | 3 | 0.5% |
| Scotch-Irish | 33 | 5.5% |
| Scottish | 43 | 7.2% |
| Swiss | 6 | 1.0% |
| Welsh | 15 | 2.5% | View All 19 Rows |
Immigrants in Hayesville

| Immigration Origin | # Population | % Population | View All 0 Rows |
Sex and Age in Hayesville
Sex and Age in Hayesville
The most populous age groups in Hayesville are 40 to 44 Years (43 | 16.9%) for men and 5 to 9 Years (68 | 19.8%) for women.
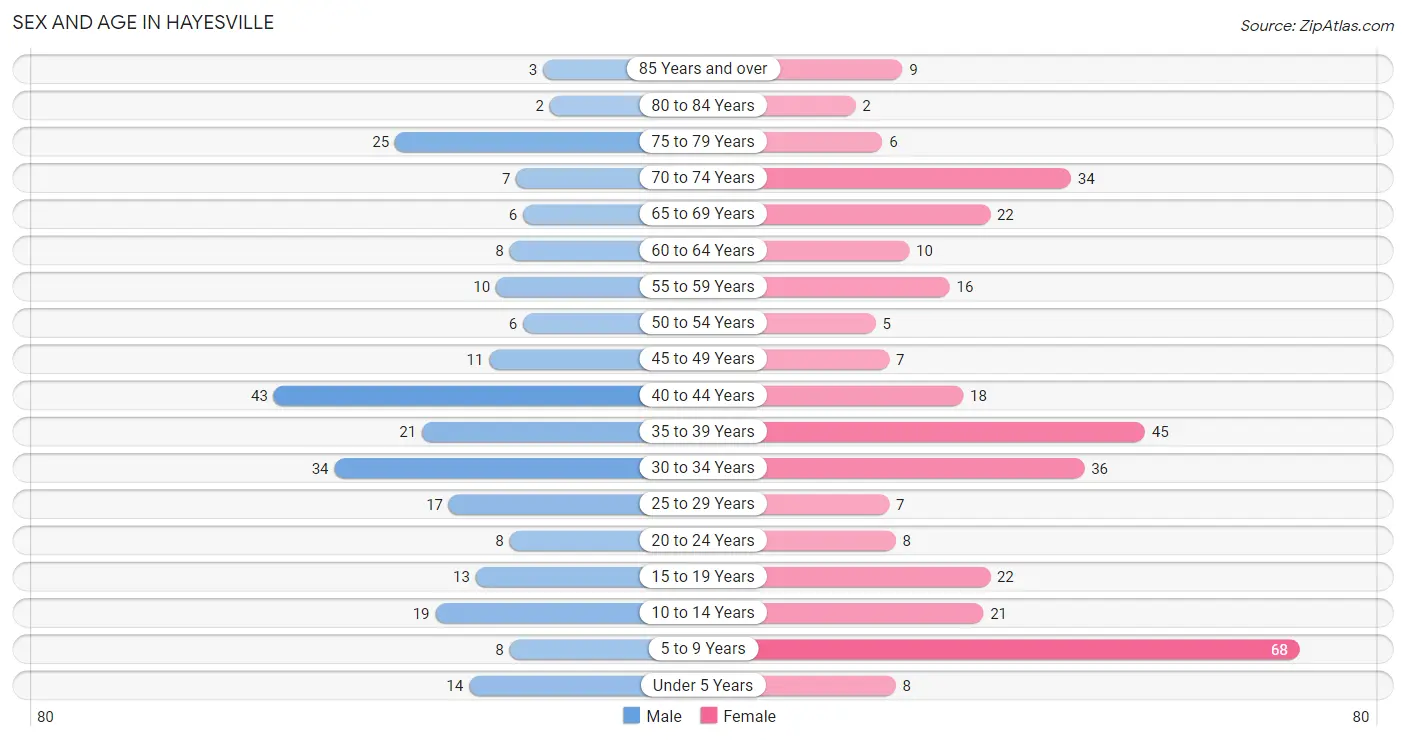
| Age Bracket | Male | Female |
| Under 5 Years | 14 (5.5%) | 8 (2.3%) |
| 5 to 9 Years | 8 (3.1%) | 68 (19.8%) |
| 10 to 14 Years | 19 (7.4%) | 21 (6.1%) |
| 15 to 19 Years | 13 (5.1%) | 22 (6.4%) |
| 20 to 24 Years | 8 (3.1%) | 8 (2.3%) |
| 25 to 29 Years | 17 (6.7%) | 7 (2.0%) |
| 30 to 34 Years | 34 (13.3%) | 36 (10.5%) |
| 35 to 39 Years | 21 (8.2%) | 45 (13.1%) |
| 40 to 44 Years | 43 (16.9%) | 18 (5.2%) |
| 45 to 49 Years | 11 (4.3%) | 7 (2.0%) |
| 50 to 54 Years | 6 (2.4%) | 5 (1.5%) |
| 55 to 59 Years | 10 (3.9%) | 16 (4.6%) |
| 60 to 64 Years | 8 (3.1%) | 10 (2.9%) |
| 65 to 69 Years | 6 (2.4%) | 22 (6.4%) |
| 70 to 74 Years | 7 (2.8%) | 34 (9.9%) |
| 75 to 79 Years | 25 (9.8%) | 6 (1.7%) |
| 80 to 84 Years | 2 (0.8%) | 2 (0.6%) |
| 85 Years and over | 3 (1.2%) | 9 (2.6%) |
| Total | 255 (100.0%) | 344 (100.0%) |
Families and Households in Hayesville
Median Family Size in Hayesville
The median family size in Hayesville is 2.74 persons per family, with married-couple families (155 | 80.7%) accounting for the largest median family size of 2.83 persons per family. On the other hand, single female/mother families (26 | 13.5%) represent the smallest median family size with 2.31 persons per family.
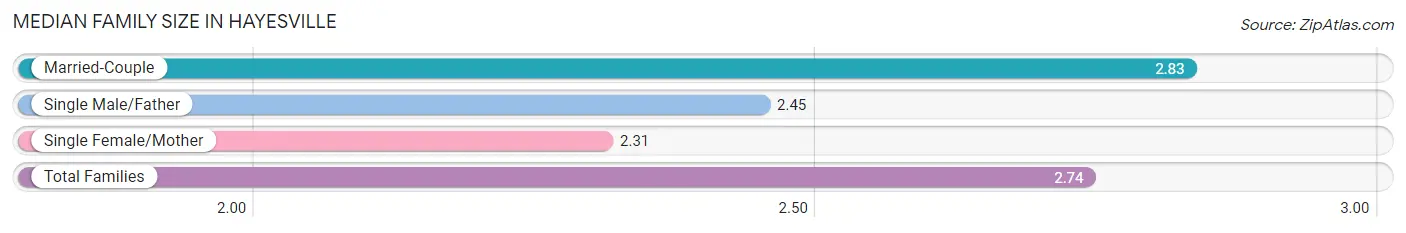
| Family Type | # Families | Family Size |
| Married-Couple | 155 (80.7%) | 2.83 |
| Single Male/Father | 11 (5.7%) | 2.45 |
| Single Female/Mother | 26 (13.5%) | 2.31 |
| Total Families | 192 (100.0%) | 2.74 |
Median Household Size in Hayesville
The median household size in Hayesville is 2.43 persons per household, with single male/father households (11 | 4.5%) accounting for the largest median household size of 3.09 persons per household. non-family households (54 | 22.0%) represent the smallest median household size with 1.22 persons per household.
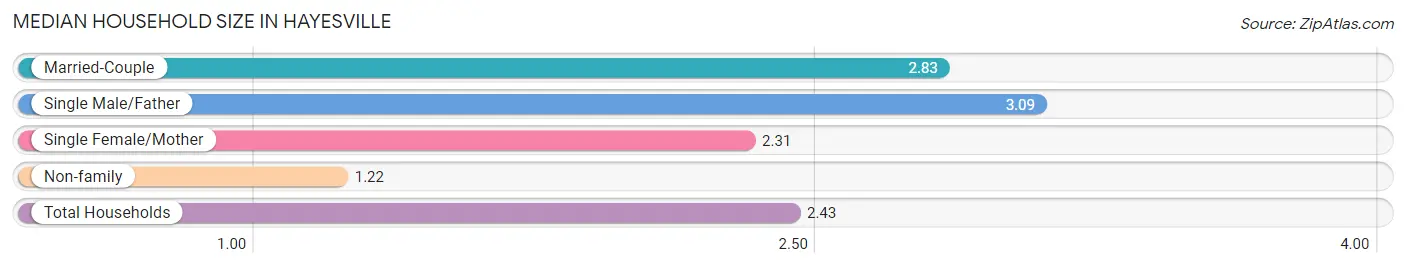
| Household Type | # Households | Household Size |
| Married-Couple | 155 (63.0%) | 2.83 |
| Single Male/Father | 11 (4.5%) | 3.09 |
| Single Female/Mother | 26 (10.6%) | 2.31 |
| Non-family | 54 (22.0%) | 1.22 |
| Total Households | 246 (100.0%) | 2.43 |
Household Size by Marriage Status in Hayesville
Out of a total of 246 households in Hayesville, 192 (78.0%) are family households, while 54 (22.0%) are nonfamily households. The most numerous type of family households are 2-person households, comprising 118, and the most common type of nonfamily households are 1-person households, comprising 44.
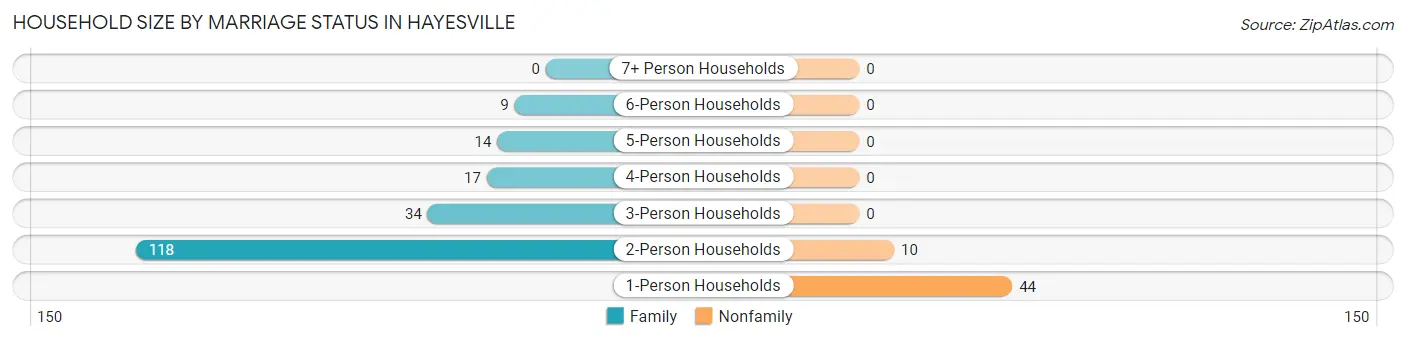
| Household Size | Family Households | Nonfamily Households |
| 1-Person Households | - | 44 (17.9%) |
| 2-Person Households | 118 (48.0%) | 10 (4.1%) |
| 3-Person Households | 34 (13.8%) | 0 (0.0%) |
| 4-Person Households | 17 (6.9%) | 0 (0.0%) |
| 5-Person Households | 14 (5.7%) | 0 (0.0%) |
| 6-Person Households | 9 (3.7%) | 0 (0.0%) |
| 7+ Person Households | 0 (0.0%) | 0 (0.0%) |
| Total | 192 (78.0%) | 54 (22.0%) |
Female Fertility in Hayesville
Fertility by Age in Hayesville
Average fertility rate in Hayesville is 21.0 births per 1,000 women. Women in the age bracket of 20 to 34 years have the highest fertility rate with 59.0 births per 1,000 women. Women in the age bracket of 20 to 34 years acount for 100.0% of all women with births.
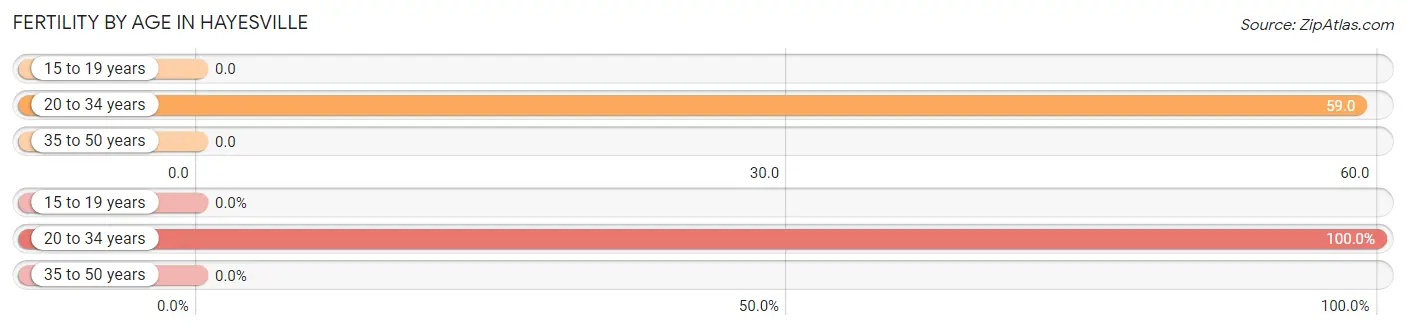
| Age Bracket | Women with Births | Births / 1,000 Women |
| 15 to 19 years | 0 (0.0%) | 0.0 |
| 20 to 34 years | 3 (100.0%) | 59.0 |
| 35 to 50 years | 0 (0.0%) | 0.0 |
| Total | 3 (100.0%) | 21.0 |
Fertility by Age by Marriage Status in Hayesville
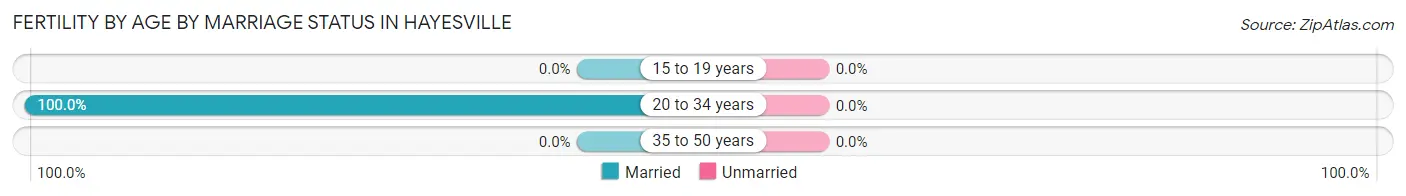
| Age Bracket | Married | Unmarried |
| 15 to 19 years | 0 (0.0%) | 0 (0.0%) |
| 20 to 34 years | 3 (100.0%) | 0 (0.0%) |
| 35 to 50 years | 0 (0.0%) | 0 (0.0%) |
| Total | 3 (100.0%) | 0 (0.0%) |
Fertility by Education in Hayesville
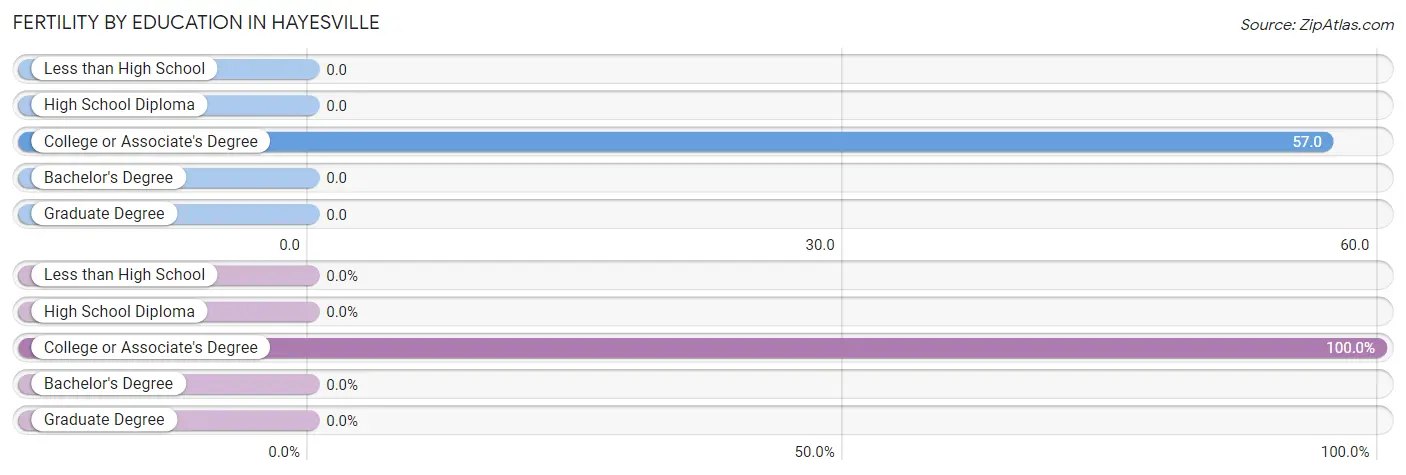
| Educational Attainment | Women with Births | Births / 1,000 Women |
| Less than High School | 0 (0.0%) | 0.0 |
| High School Diploma | 0 (0.0%) | 0.0 |
| College or Associate's Degree | 3 (100.0%) | 57.0 |
| Bachelor's Degree | 0 (0.0%) | 0.0 |
| Graduate Degree | 0 (0.0%) | 0.0 |
| Total | 3 (100.0%) | 21.0 |
Fertility by Education by Marriage Status in Hayesville
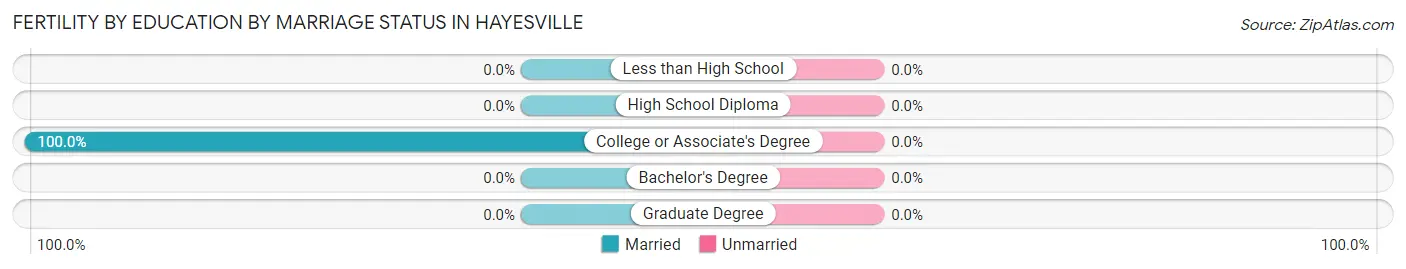
| Educational Attainment | Married | Unmarried |
| Less than High School | 0 (0.0%) | 0 (0.0%) |
| High School Diploma | 0 (0.0%) | 0 (0.0%) |
| College or Associate's Degree | 3 (100.0%) | 0 (0.0%) |
| Bachelor's Degree | 0 (0.0%) | 0 (0.0%) |
| Graduate Degree | 0 (0.0%) | 0 (0.0%) |
| Total | 3 (100.0%) | 0 (0.0%) |
Employment Characteristics in Hayesville
Employment by Class of Employer in Hayesville
Among the 280 employed individuals in Hayesville, private company employees (170 | 60.7%), not-for-profit organizations (41 | 14.6%), and local government employees (40 | 14.3%) make up the most common classes of employment.
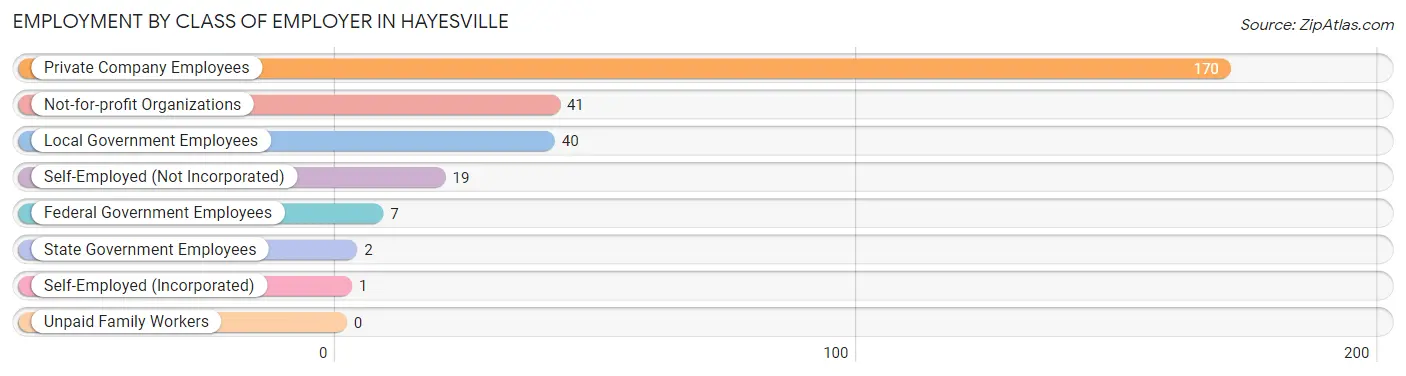
| Employer Class | # Employees | % Employees |
| Private Company Employees | 170 | 60.7% |
| Self-Employed (Incorporated) | 1 | 0.4% |
| Self-Employed (Not Incorporated) | 19 | 6.8% |
| Not-for-profit Organizations | 41 | 14.6% |
| Local Government Employees | 40 | 14.3% |
| State Government Employees | 2 | 0.7% |
| Federal Government Employees | 7 | 2.5% |
| Unpaid Family Workers | 0 | 0.0% |
| Total | 280 | 100.0% |
Employment Status by Age in Hayesville
According to the labor force statistics for Hayesville, out of the total population over 16 years of age (457), 64.3% or 294 individuals are in the labor force, with 3.4% or 10 of them unemployed. The age group with the highest labor force participation rate is 25 to 29 years, with 100.0% or 24 individuals in the labor force. Within the labor force, the 20 to 24 years age range has the highest percentage of unemployed individuals, with 23.1% or 3 of them being unemployed.
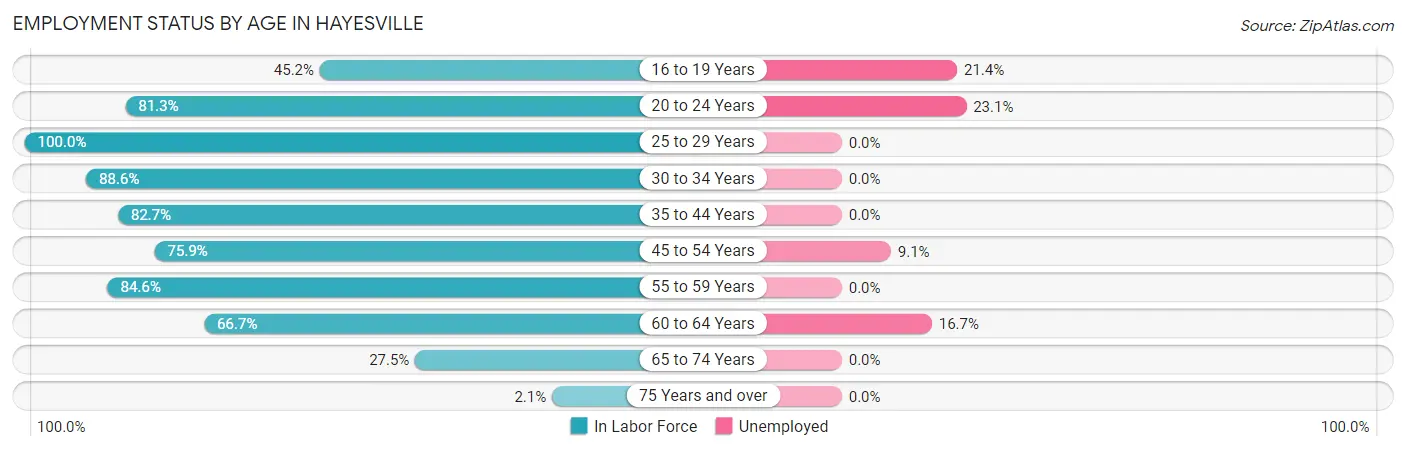
| Age Bracket | In Labor Force | Unemployed |
| 16 to 19 Years | 14 (45.2%) | 3 (21.4%) |
| 20 to 24 Years | 13 (81.3%) | 3 (23.1%) |
| 25 to 29 Years | 24 (100.0%) | 0 (0.0%) |
| 30 to 34 Years | 62 (88.6%) | 0 (0.0%) |
| 35 to 44 Years | 105 (82.7%) | 0 (0.0%) |
| 45 to 54 Years | 22 (75.9%) | 2 (9.1%) |
| 55 to 59 Years | 22 (84.6%) | 0 (0.0%) |
| 60 to 64 Years | 12 (66.7%) | 2 (16.7%) |
| 65 to 74 Years | 19 (27.5%) | 0 (0.0%) |
| 75 Years and over | 1 (2.1%) | 0 (0.0%) |
| Total | 294 (64.3%) | 10 (3.4%) |
Employment Status by Educational Attainment in Hayesville
According to labor force statistics for Hayesville, 84.0% of individuals (247) out of the total population between 25 and 64 years of age (294) are in the labor force, with 1.6% or 4 of them being unemployed. The group with the highest labor force participation rate are those with the educational attainment of bachelor's degree or higher, with 95.3% or 81 individuals in the labor force. Within the labor force, individuals with high school diploma education have the highest percentage of unemployment, with 4.3% or 4 of them being unemployed.
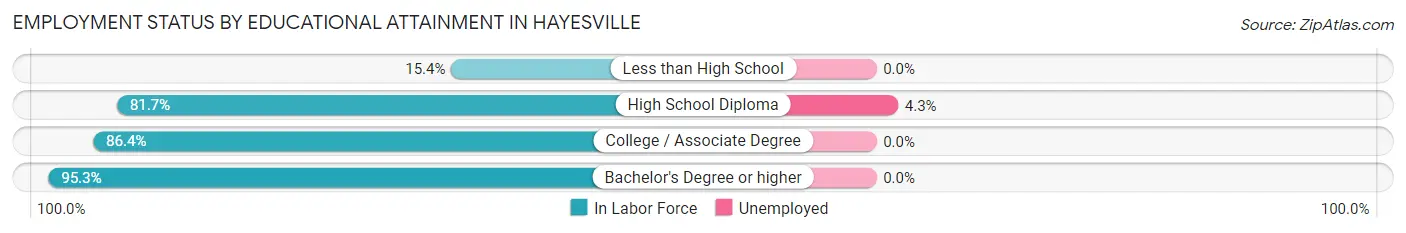
| Educational Attainment | In Labor Force | Unemployed |
| Less than High School | 2 (15.4%) | 0 (0.0%) |
| High School Diploma | 94 (81.7%) | 5 (4.3%) |
| College / Associate Degree | 70 (86.4%) | 0 (0.0%) |
| Bachelor's Degree or higher | 81 (95.3%) | 0 (0.0%) |
| Total | 247 (84.0%) | 5 (1.6%) |
Employment Occupations by Sex in Hayesville
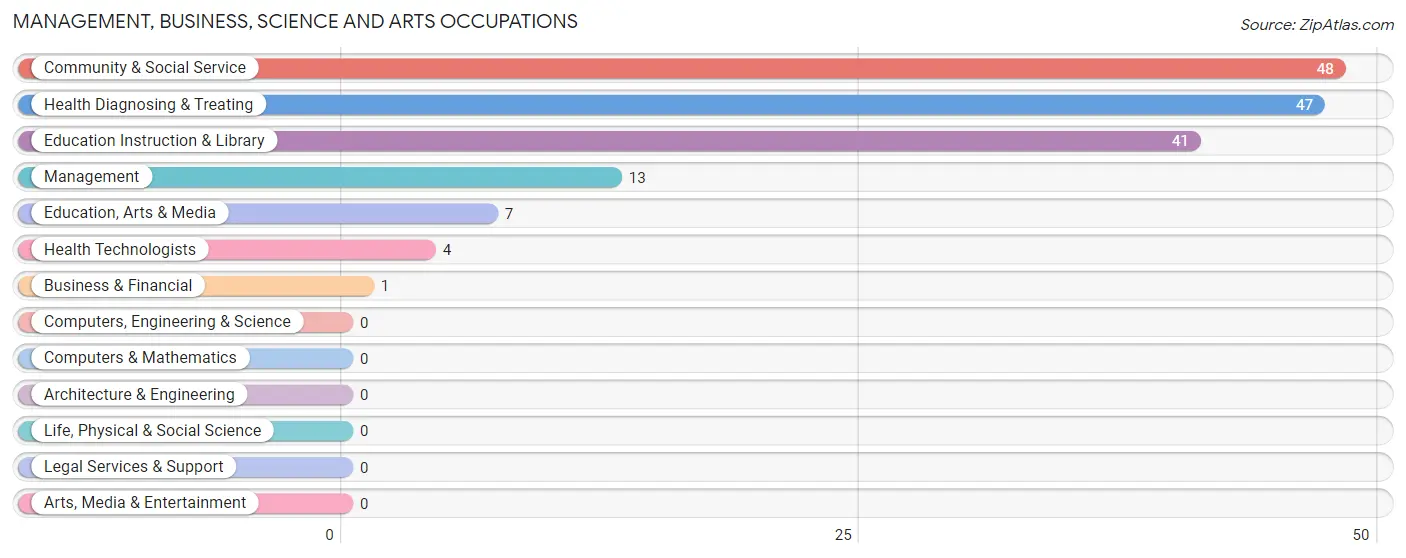
Management, Business, Science and Arts Occupations
The most common Management, Business, Science and Arts occupations in Hayesville are Community & Social Service (48 | 16.9%), Health Diagnosing & Treating (47 | 16.6%), Education Instruction & Library (41 | 14.4%), Management (13 | 4.6%), and Education, Arts & Media (7 | 2.5%).
Management, Business, Science and Arts Occupations by Sex
Within the Management, Business, Science and Arts occupations in Hayesville, the most male-oriented occupations are Education Instruction & Library (90.2%), Community & Social Service (81.2%), and Management (38.5%), while the most female-oriented occupations are Business & Financial (100.0%), Health Diagnosing & Treating (100.0%), and Health Technologists (100.0%).
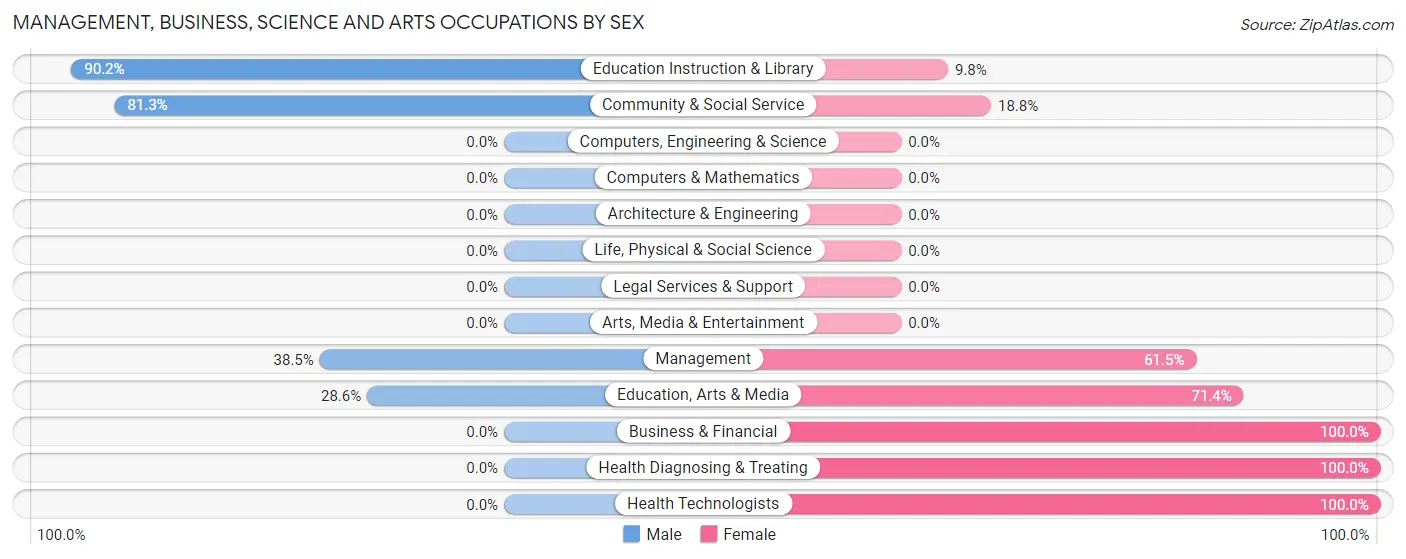
| Occupation | Male | Female |
| Management | 5 (38.5%) | 8 (61.5%) |
| Business & Financial | 0 (0.0%) | 1 (100.0%) |
| Computers, Engineering & Science | 0 (0.0%) | 0 (0.0%) |
| Computers & Mathematics | 0 (0.0%) | 0 (0.0%) |
| Architecture & Engineering | 0 (0.0%) | 0 (0.0%) |
| Life, Physical & Social Science | 0 (0.0%) | 0 (0.0%) |
| Community & Social Service | 39 (81.2%) | 9 (18.8%) |
| Education, Arts & Media | 2 (28.6%) | 5 (71.4%) |
| Legal Services & Support | 0 (0.0%) | 0 (0.0%) |
| Education Instruction & Library | 37 (90.2%) | 4 (9.8%) |
| Arts, Media & Entertainment | 0 (0.0%) | 0 (0.0%) |
| Health Diagnosing & Treating | 0 (0.0%) | 47 (100.0%) |
| Health Technologists | 0 (0.0%) | 4 (100.0%) |
| Total (Category) | 44 (40.4%) | 65 (59.6%) |
| Total (Overall) | 149 (52.5%) | 135 (47.5%) |
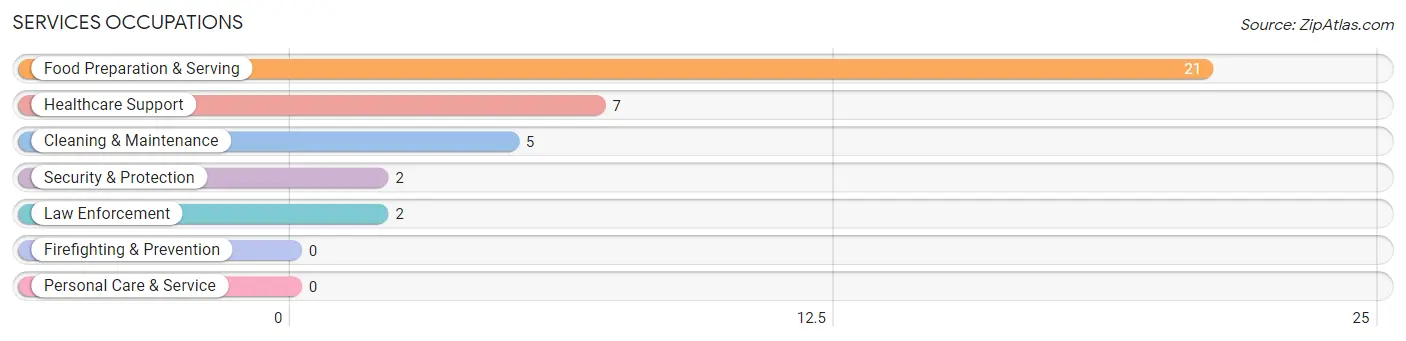
Services Occupations
The most common Services occupations in Hayesville are Food Preparation & Serving (21 | 7.4%), Healthcare Support (7 | 2.5%), Cleaning & Maintenance (5 | 1.8%), Security & Protection (2 | 0.7%), and Law Enforcement (2 | 0.7%).
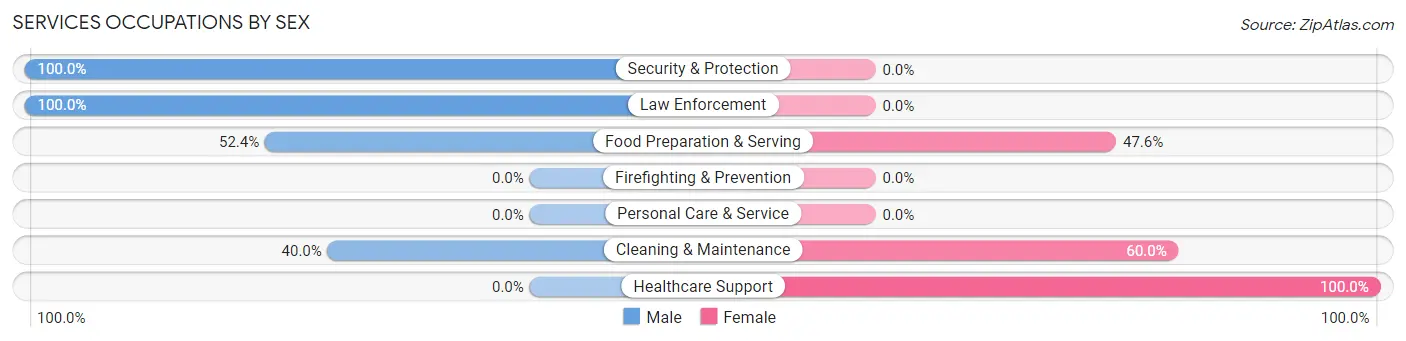
Services Occupations by Sex
Within the Services occupations in Hayesville, the most male-oriented occupations are Security & Protection (100.0%), Law Enforcement (100.0%), and Food Preparation & Serving (52.4%), while the most female-oriented occupations are Healthcare Support (100.0%), Cleaning & Maintenance (60.0%), and Food Preparation & Serving (47.6%).
| Occupation | Male | Female |
| Healthcare Support | 0 (0.0%) | 7 (100.0%) |
| Security & Protection | 2 (100.0%) | 0 (0.0%) |
| Firefighting & Prevention | 0 (0.0%) | 0 (0.0%) |
| Law Enforcement | 2 (100.0%) | 0 (0.0%) |
| Food Preparation & Serving | 11 (52.4%) | 10 (47.6%) |
| Cleaning & Maintenance | 2 (40.0%) | 3 (60.0%) |
| Personal Care & Service | 0 (0.0%) | 0 (0.0%) |
| Total (Category) | 15 (42.9%) | 20 (57.1%) |
| Total (Overall) | 149 (52.5%) | 135 (47.5%) |
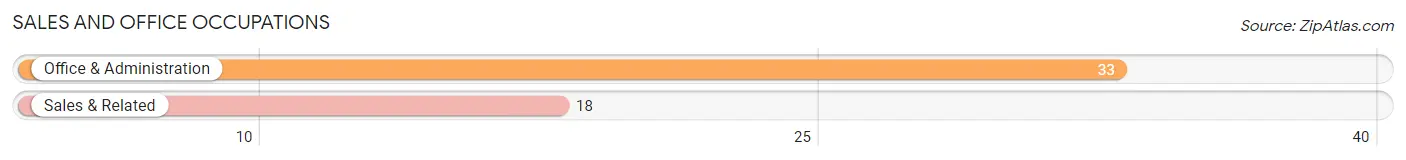
Sales and Office Occupations
The most common Sales and Office occupations in Hayesville are Office & Administration (33 | 11.6%), and Sales & Related (18 | 6.3%).
Sales and Office Occupations by Sex
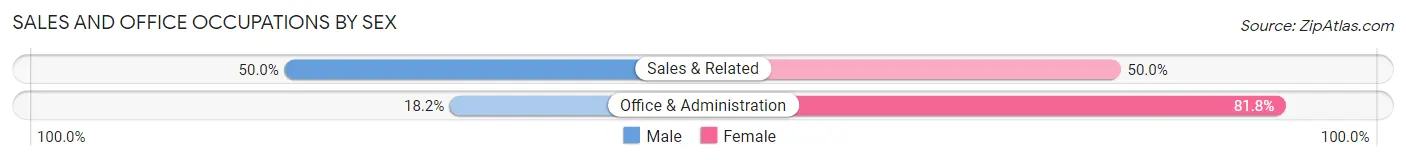
| Occupation | Male | Female |
| Sales & Related | 9 (50.0%) | 9 (50.0%) |
| Office & Administration | 6 (18.2%) | 27 (81.8%) |
| Total (Category) | 15 (29.4%) | 36 (70.6%) |
| Total (Overall) | 149 (52.5%) | 135 (47.5%) |
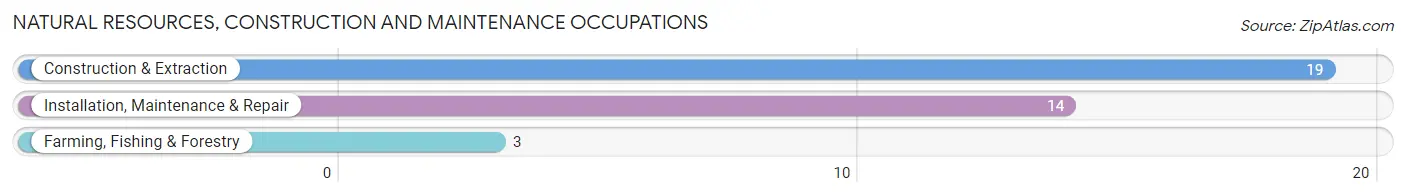
Natural Resources, Construction and Maintenance Occupations
The most common Natural Resources, Construction and Maintenance occupations in Hayesville are Construction & Extraction (19 | 6.7%), Installation, Maintenance & Repair (14 | 4.9%), and Farming, Fishing & Forestry (3 | 1.1%).
Natural Resources, Construction and Maintenance Occupations by Sex
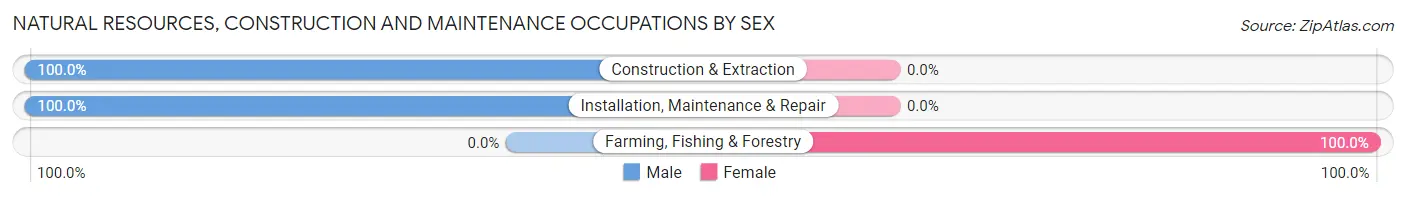
| Occupation | Male | Female |
| Farming, Fishing & Forestry | 0 (0.0%) | 3 (100.0%) |
| Construction & Extraction | 19 (100.0%) | 0 (0.0%) |
| Installation, Maintenance & Repair | 14 (100.0%) | 0 (0.0%) |
| Total (Category) | 33 (91.7%) | 3 (8.3%) |
| Total (Overall) | 149 (52.5%) | 135 (47.5%) |
Production, Transportation and Moving Occupations
The most common Production, Transportation and Moving occupations in Hayesville are Production (33 | 11.6%), Material Moving (16 | 5.6%), and Transportation (4 | 1.4%).
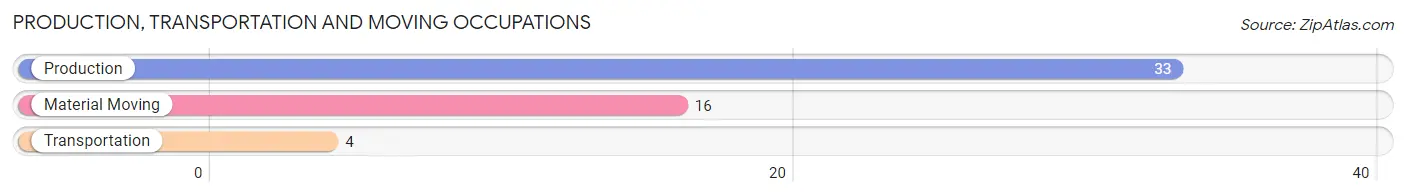
Production, Transportation and Moving Occupations by Sex
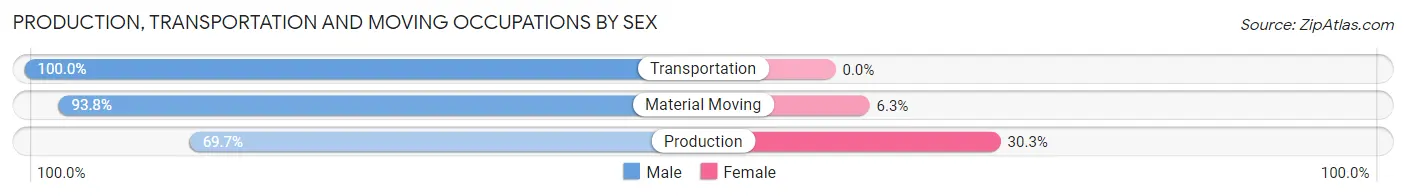
| Occupation | Male | Female |
| Production | 23 (69.7%) | 10 (30.3%) |
| Transportation | 4 (100.0%) | 0 (0.0%) |
| Material Moving | 15 (93.8%) | 1 (6.2%) |
| Total (Category) | 42 (79.2%) | 11 (20.7%) |
| Total (Overall) | 149 (52.5%) | 135 (47.5%) |
Employment Industries by Sex in Hayesville
Employment Industries in Hayesville
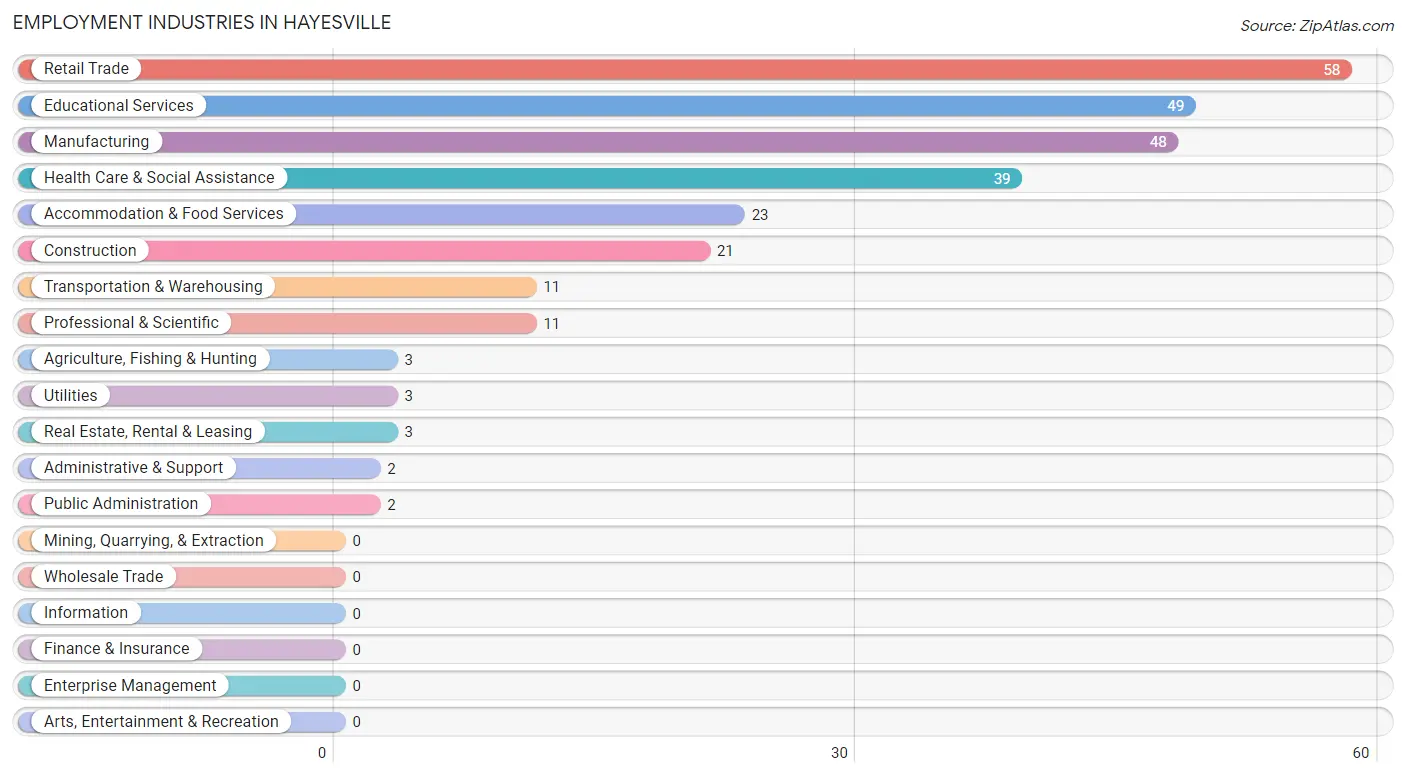
The major employment industries in Hayesville include Retail Trade (58 | 20.4%), Educational Services (49 | 17.2%), Manufacturing (48 | 16.9%), Health Care & Social Assistance (39 | 13.7%), and Accommodation & Food Services (23 | 8.1%).
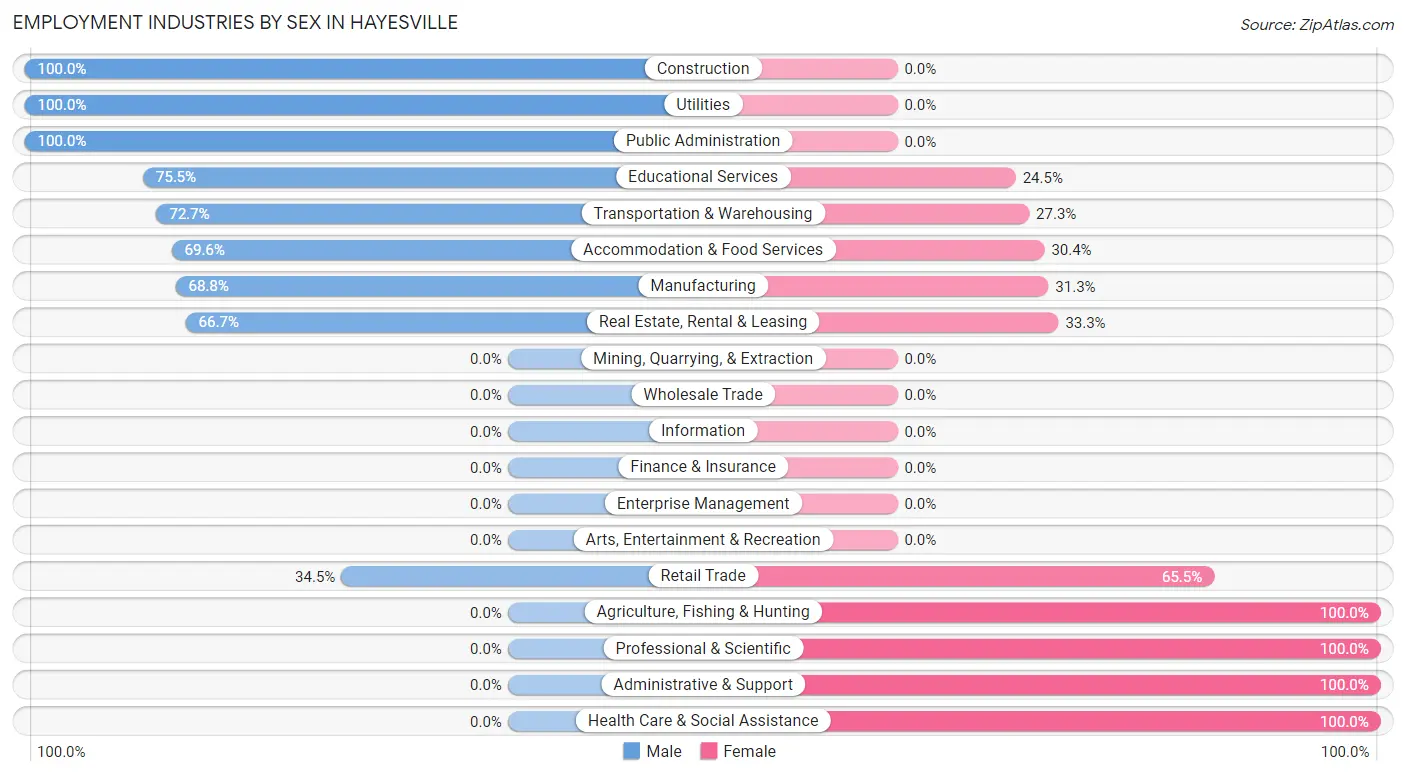
Employment Industries by Sex in Hayesville
The Hayesville industries that see more men than women are Construction (100.0%), Utilities (100.0%), and Public Administration (100.0%), whereas the industries that tend to have a higher number of women are Agriculture, Fishing & Hunting (100.0%), Professional & Scientific (100.0%), and Administrative & Support (100.0%).
| Industry | Male | Female |
| Agriculture, Fishing & Hunting | 0 (0.0%) | 3 (100.0%) |
| Mining, Quarrying, & Extraction | 0 (0.0%) | 0 (0.0%) |
| Construction | 21 (100.0%) | 0 (0.0%) |
| Manufacturing | 33 (68.8%) | 15 (31.2%) |
| Wholesale Trade | 0 (0.0%) | 0 (0.0%) |
| Retail Trade | 20 (34.5%) | 38 (65.5%) |
| Transportation & Warehousing | 8 (72.7%) | 3 (27.3%) |
| Utilities | 3 (100.0%) | 0 (0.0%) |
| Information | 0 (0.0%) | 0 (0.0%) |
| Finance & Insurance | 0 (0.0%) | 0 (0.0%) |
| Real Estate, Rental & Leasing | 2 (66.7%) | 1 (33.3%) |
| Professional & Scientific | 0 (0.0%) | 11 (100.0%) |
| Enterprise Management | 0 (0.0%) | 0 (0.0%) |
| Administrative & Support | 0 (0.0%) | 2 (100.0%) |
| Educational Services | 37 (75.5%) | 12 (24.5%) |
| Health Care & Social Assistance | 0 (0.0%) | 39 (100.0%) |
| Arts, Entertainment & Recreation | 0 (0.0%) | 0 (0.0%) |
| Accommodation & Food Services | 16 (69.6%) | 7 (30.4%) |
| Public Administration | 2 (100.0%) | 0 (0.0%) |
| Total | 149 (52.5%) | 135 (47.5%) |
Education in Hayesville
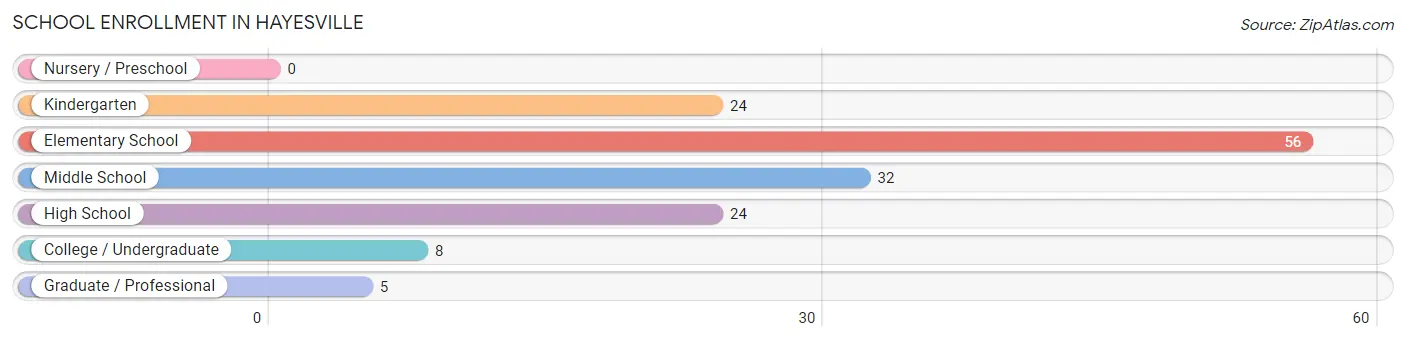
School Enrollment in Hayesville
The most common levels of schooling among the 149 students in Hayesville are elementary school (56 | 37.6%), middle school (32 | 21.5%), and kindergarten (24 | 16.1%).
| School Level | # Students | % Students |
| Nursery / Preschool | 0 | 0.0% |
| Kindergarten | 24 | 16.1% |
| Elementary School | 56 | 37.6% |
| Middle School | 32 | 21.5% |
| High School | 24 | 16.1% |
| College / Undergraduate | 8 | 5.4% |
| Graduate / Professional | 5 | 3.4% |
| Total | 149 | 100.0% |
School Enrollment by Age by Funding Source in Hayesville
Out of a total of 149 students who are enrolled in schools in Hayesville, 52 (34.9%) attend a private institution, while the remaining 97 (65.1%) are enrolled in public schools. The age group of 18 to 19 year olds has the highest likelihood of being enrolled in private schools, with 2 (66.7% in the age bracket) enrolled. Conversely, the age group of 10 to 14 year olds has the lowest likelihood of being enrolled in a private school, with 36 (100.0% in the age bracket) attending a public institution.
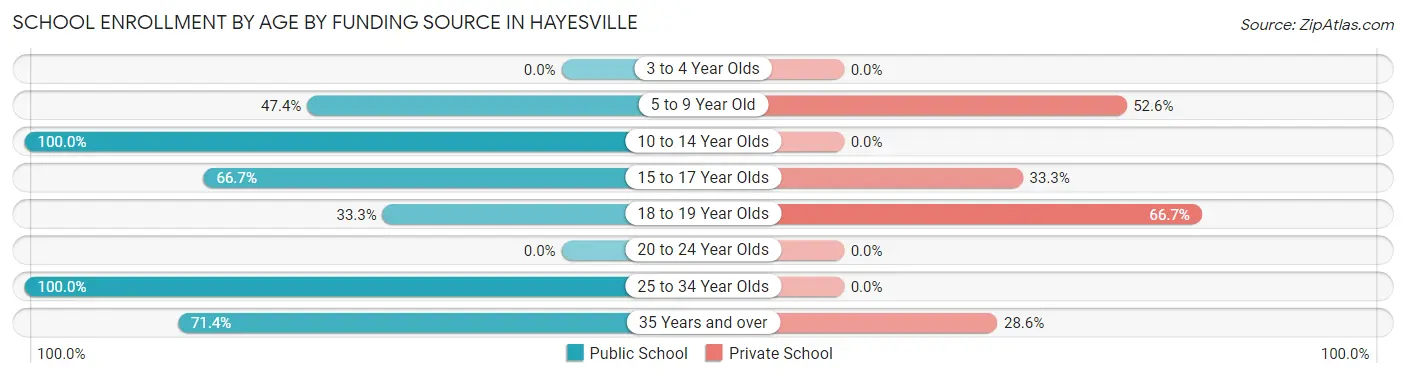
| Age Bracket | Public School | Private School |
| 3 to 4 Year Olds | 0 (0.0%) | 0 (0.0%) |
| 5 to 9 Year Old | 36 (47.4%) | 40 (52.6%) |
| 10 to 14 Year Olds | 36 (100.0%) | 0 (0.0%) |
| 15 to 17 Year Olds | 16 (66.7%) | 8 (33.3%) |
| 18 to 19 Year Olds | 1 (33.3%) | 2 (66.7%) |
| 20 to 24 Year Olds | 0 (0.0%) | 0 (0.0%) |
| 25 to 34 Year Olds | 3 (100.0%) | 0 (0.0%) |
| 35 Years and over | 5 (71.4%) | 2 (28.6%) |
| Total | 97 (65.1%) | 52 (34.9%) |
Educational Attainment by Field of Study in Hayesville
Education (62 | 60.2%), bio, nature & agricultural (10 | 9.7%), science & technology (9 | 8.7%), business (8 | 7.8%), and literature & languages (4 | 3.9%) are the most common fields of study among 103 individuals in Hayesville who have obtained a bachelor's degree or higher.
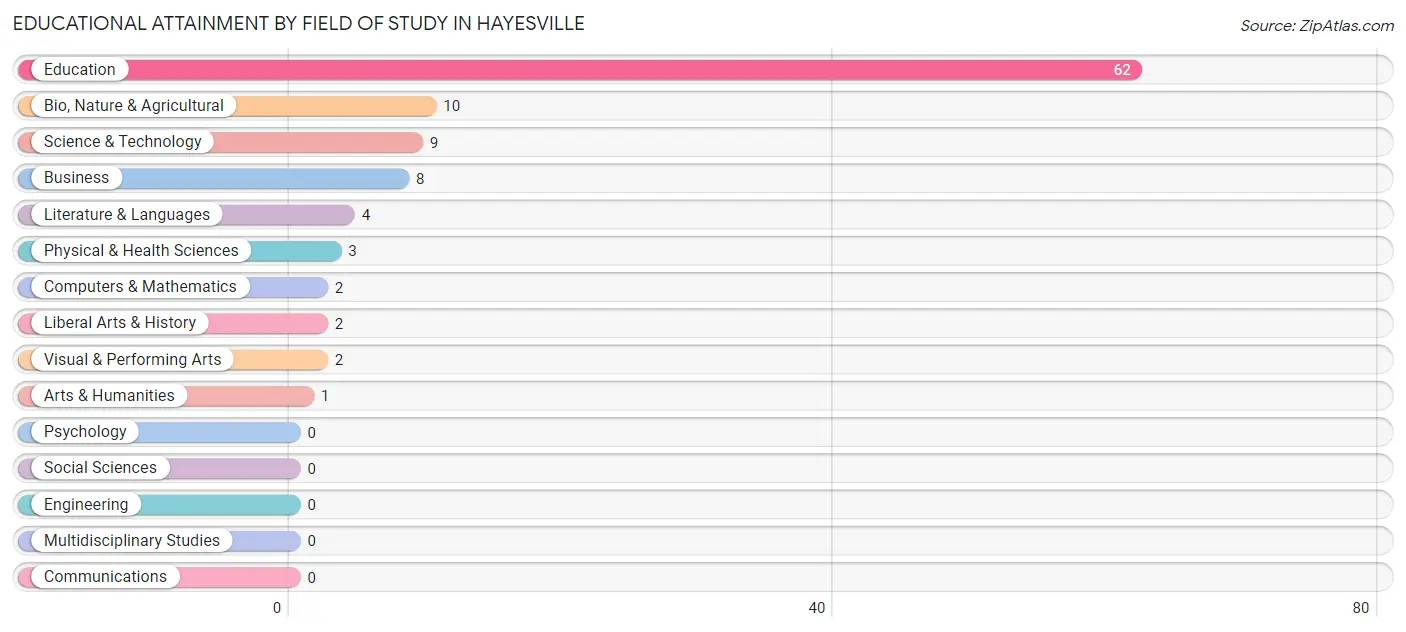
| Field of Study | # Graduates | % Graduates |
| Computers & Mathematics | 2 | 1.9% |
| Bio, Nature & Agricultural | 10 | 9.7% |
| Physical & Health Sciences | 3 | 2.9% |
| Psychology | 0 | 0.0% |
| Social Sciences | 0 | 0.0% |
| Engineering | 0 | 0.0% |
| Multidisciplinary Studies | 0 | 0.0% |
| Science & Technology | 9 | 8.7% |
| Business | 8 | 7.8% |
| Education | 62 | 60.2% |
| Literature & Languages | 4 | 3.9% |
| Liberal Arts & History | 2 | 1.9% |
| Visual & Performing Arts | 2 | 1.9% |
| Communications | 0 | 0.0% |
| Arts & Humanities | 1 | 1.0% |
| Total | 103 | 100.0% |
Transportation & Commute in Hayesville
Vehicle Availability by Sex in Hayesville
The most prevalent vehicle ownership categories in Hayesville are males with 2 vehicles (95, accounting for 64.6%) and females with 2 vehicles (92, making up 71.4%).
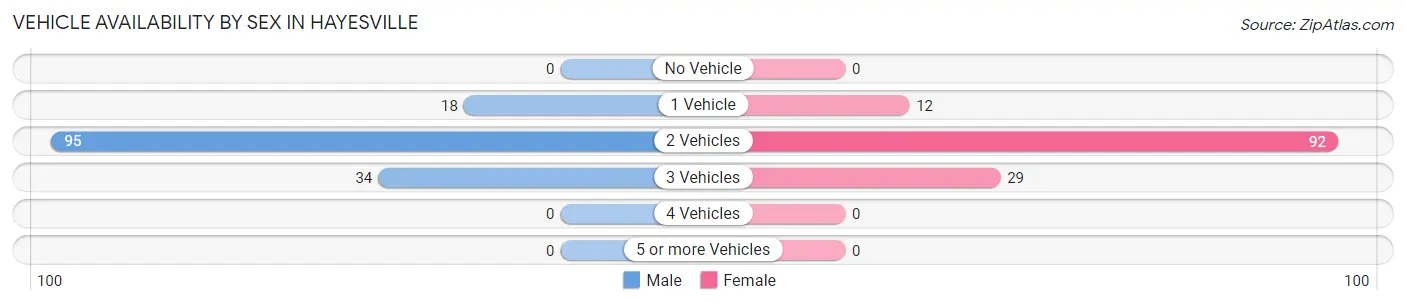
| Vehicles Available | Male | Female |
| No Vehicle | 0 (0.0%) | 0 (0.0%) |
| 1 Vehicle | 18 (12.2%) | 12 (9.0%) |
| 2 Vehicles | 95 (64.6%) | 92 (69.2%) |
| 3 Vehicles | 34 (23.1%) | 29 (21.8%) |
| 4 Vehicles | 0 (0.0%) | 0 (0.0%) |
| 5 or more Vehicles | 0 (0.0%) | 0 (0.0%) |
| Total | 147 (100.0%) | 133 (100.0%) |
Commute Time in Hayesville
The most frequently occuring commute durations in Hayesville are 25 to 29 minutes (67 commuters, 24.3%), 10 to 14 minutes (63 commuters, 22.8%), and 15 to 19 minutes (39 commuters, 14.1%).
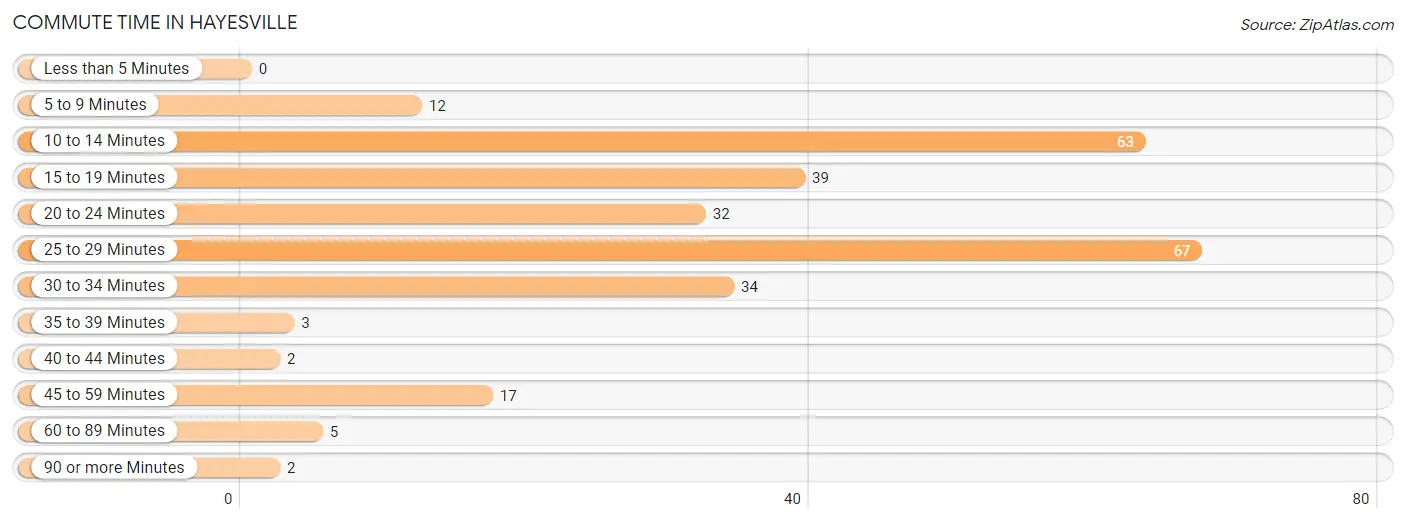
| Commute Time | # Commuters | % Commuters |
| Less than 5 Minutes | 0 | 0.0% |
| 5 to 9 Minutes | 12 | 4.3% |
| 10 to 14 Minutes | 63 | 22.8% |
| 15 to 19 Minutes | 39 | 14.1% |
| 20 to 24 Minutes | 32 | 11.6% |
| 25 to 29 Minutes | 67 | 24.3% |
| 30 to 34 Minutes | 34 | 12.3% |
| 35 to 39 Minutes | 3 | 1.1% |
| 40 to 44 Minutes | 2 | 0.7% |
| 45 to 59 Minutes | 17 | 6.2% |
| 60 to 89 Minutes | 5 | 1.8% |
| 90 or more Minutes | 2 | 0.7% |
Commute Time by Sex in Hayesville
The most common commute times in Hayesville are 25 to 29 minutes (51 commuters, 35.4%) for males and 10 to 14 minutes (52 commuters, 39.4%) for females.
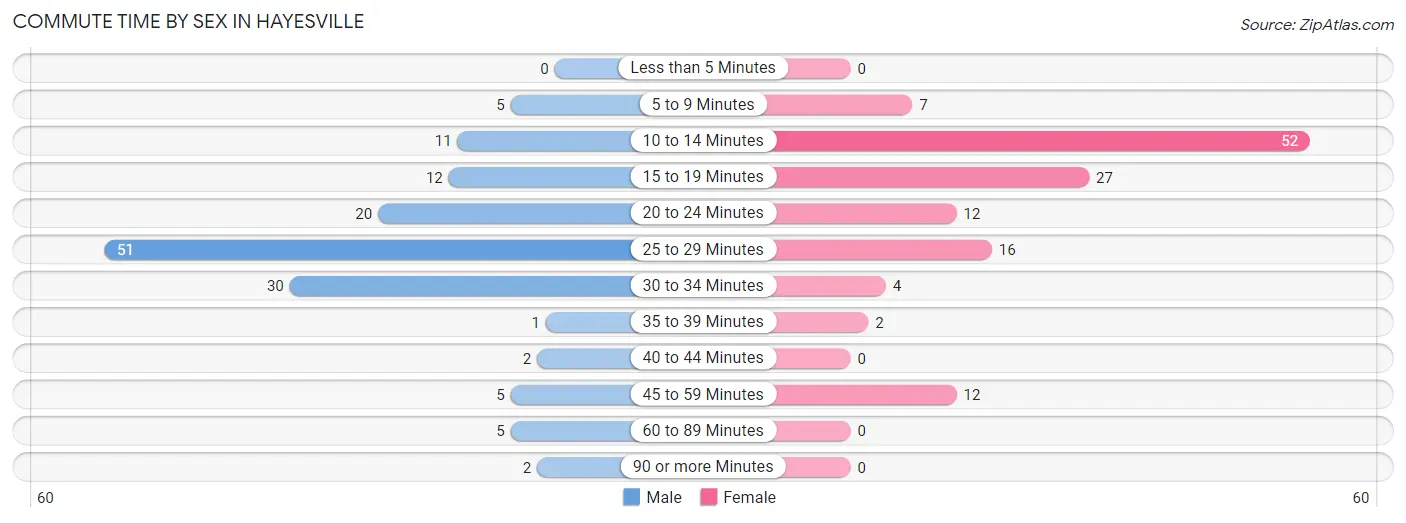
| Commute Time | Male | Female |
| Less than 5 Minutes | 0 (0.0%) | 0 (0.0%) |
| 5 to 9 Minutes | 5 (3.5%) | 7 (5.3%) |
| 10 to 14 Minutes | 11 (7.6%) | 52 (39.4%) |
| 15 to 19 Minutes | 12 (8.3%) | 27 (20.4%) |
| 20 to 24 Minutes | 20 (13.9%) | 12 (9.1%) |
| 25 to 29 Minutes | 51 (35.4%) | 16 (12.1%) |
| 30 to 34 Minutes | 30 (20.8%) | 4 (3.0%) |
| 35 to 39 Minutes | 1 (0.7%) | 2 (1.5%) |
| 40 to 44 Minutes | 2 (1.4%) | 0 (0.0%) |
| 45 to 59 Minutes | 5 (3.5%) | 12 (9.1%) |
| 60 to 89 Minutes | 5 (3.5%) | 0 (0.0%) |
| 90 or more Minutes | 2 (1.4%) | 0 (0.0%) |
Time of Departure to Work by Sex in Hayesville
The most frequent times of departure to work in Hayesville are 5:00 AM to 5:29 AM (37, 25.7%) for males and 8:00 AM to 8:29 AM (34, 25.8%) for females.
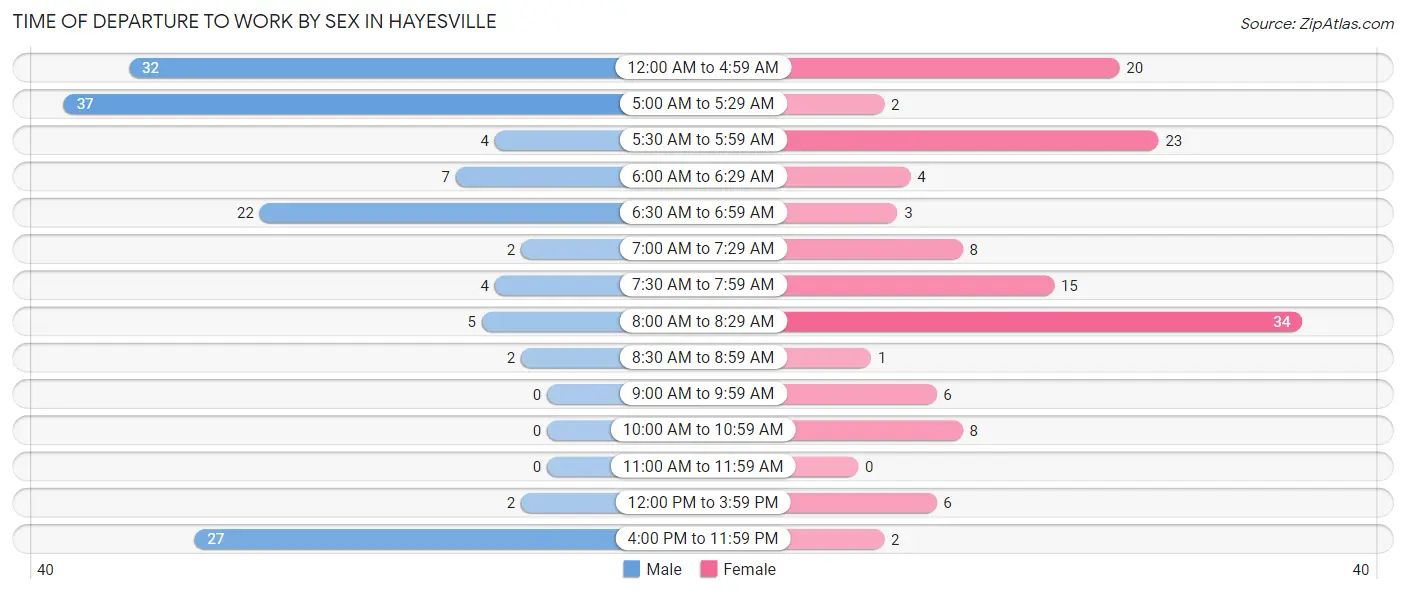
| Time of Departure | Male | Female |
| 12:00 AM to 4:59 AM | 32 (22.2%) | 20 (15.1%) |
| 5:00 AM to 5:29 AM | 37 (25.7%) | 2 (1.5%) |
| 5:30 AM to 5:59 AM | 4 (2.8%) | 23 (17.4%) |
| 6:00 AM to 6:29 AM | 7 (4.9%) | 4 (3.0%) |
| 6:30 AM to 6:59 AM | 22 (15.3%) | 3 (2.3%) |
| 7:00 AM to 7:29 AM | 2 (1.4%) | 8 (6.1%) |
| 7:30 AM to 7:59 AM | 4 (2.8%) | 15 (11.4%) |
| 8:00 AM to 8:29 AM | 5 (3.5%) | 34 (25.8%) |
| 8:30 AM to 8:59 AM | 2 (1.4%) | 1 (0.8%) |
| 9:00 AM to 9:59 AM | 0 (0.0%) | 6 (4.5%) |
| 10:00 AM to 10:59 AM | 0 (0.0%) | 8 (6.1%) |
| 11:00 AM to 11:59 AM | 0 (0.0%) | 0 (0.0%) |
| 12:00 PM to 3:59 PM | 2 (1.4%) | 6 (4.5%) |
| 4:00 PM to 11:59 PM | 27 (18.8%) | 2 (1.5%) |
| Total | 144 (100.0%) | 132 (100.0%) |
Housing Occupancy in Hayesville
Occupancy by Ownership in Hayesville
Of the total 246 dwellings in Hayesville, owner-occupied units account for 203 (82.5%), while renter-occupied units make up 43 (17.5%).
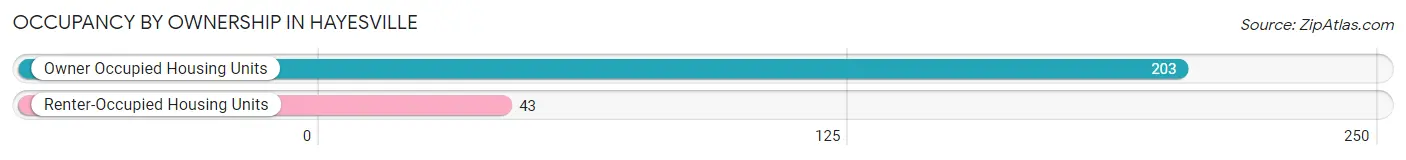
| Occupancy | # Housing Units | % Housing Units |
| Owner Occupied Housing Units | 203 | 82.5% |
| Renter-Occupied Housing Units | 43 | 17.5% |
| Total Occupied Housing Units | 246 | 100.0% |
Occupancy by Household Size in Hayesville
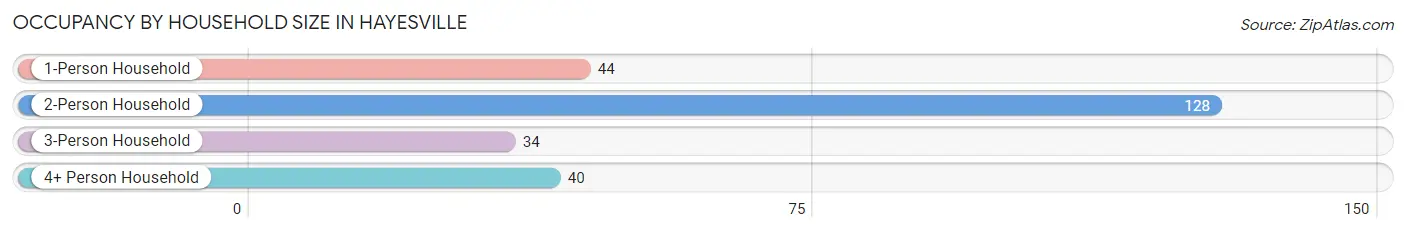
| Household Size | # Housing Units | % Housing Units |
| 1-Person Household | 44 | 17.9% |
| 2-Person Household | 128 | 52.0% |
| 3-Person Household | 34 | 13.8% |
| 4+ Person Household | 40 | 16.3% |
| Total Housing Units | 246 | 100.0% |
Occupancy by Ownership by Household Size in Hayesville
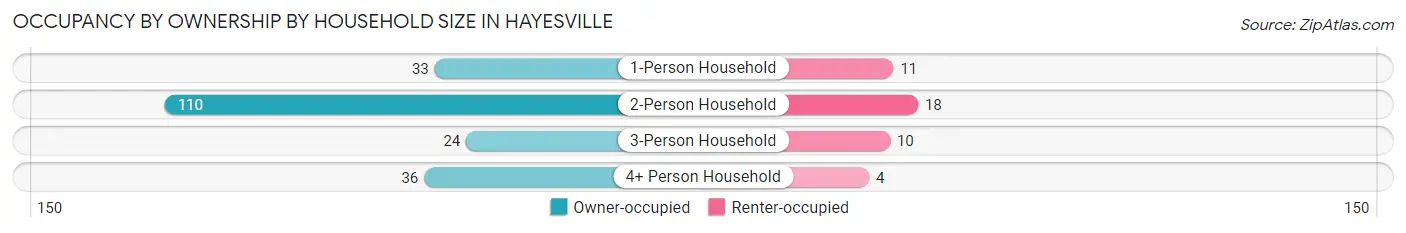
| Household Size | Owner-occupied | Renter-occupied |
| 1-Person Household | 33 (75.0%) | 11 (25.0%) |
| 2-Person Household | 110 (85.9%) | 18 (14.1%) |
| 3-Person Household | 24 (70.6%) | 10 (29.4%) |
| 4+ Person Household | 36 (90.0%) | 4 (10.0%) |
| Total Housing Units | 203 (82.5%) | 43 (17.5%) |
Occupancy by Educational Attainment in Hayesville
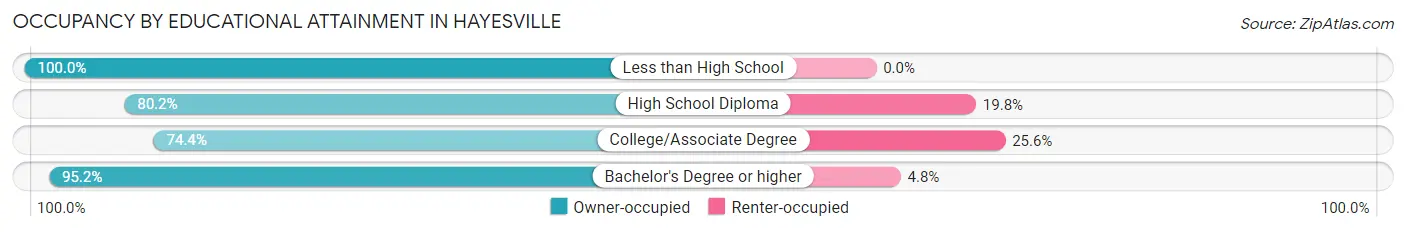
| Household Size | Owner-occupied | Renter-occupied |
| Less than High School | 7 (100.0%) | 0 (0.0%) |
| High School Diploma | 73 (80.2%) | 18 (19.8%) |
| College/Associate Degree | 64 (74.4%) | 22 (25.6%) |
| Bachelor's Degree or higher | 59 (95.2%) | 3 (4.8%) |
Occupancy by Age of Householder in Hayesville
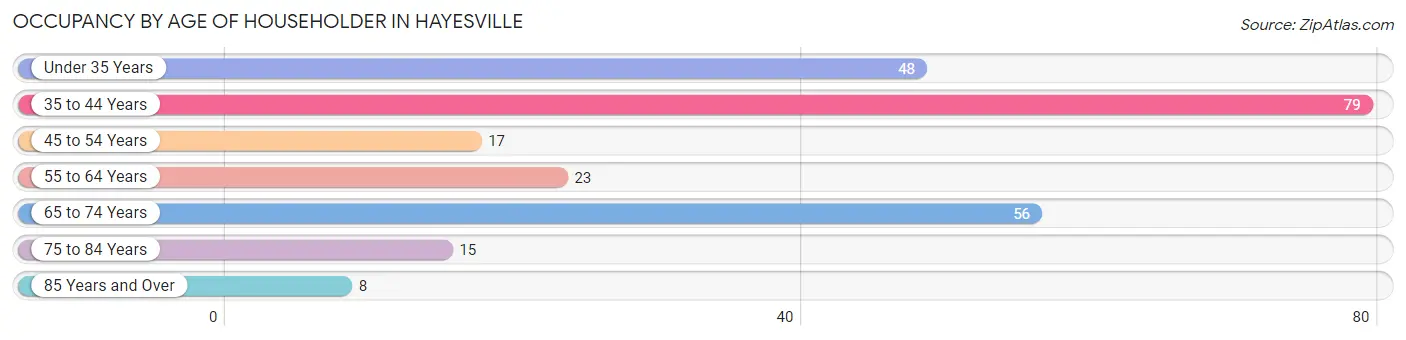
| Age Bracket | # Households | % Households |
| Under 35 Years | 48 | 19.5% |
| 35 to 44 Years | 79 | 32.1% |
| 45 to 54 Years | 17 | 6.9% |
| 55 to 64 Years | 23 | 9.3% |
| 65 to 74 Years | 56 | 22.8% |
| 75 to 84 Years | 15 | 6.1% |
| 85 Years and Over | 8 | 3.3% |
| Total | 246 | 100.0% |
Housing Finances in Hayesville
Median Income by Occupancy in Hayesville
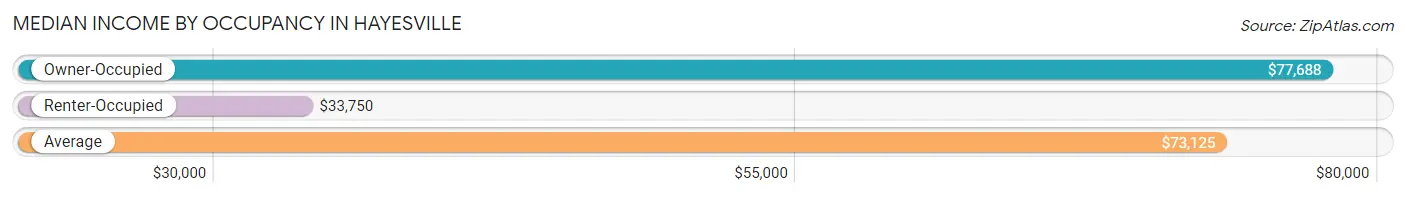
| Occupancy Type | # Households | Median Income |
| Owner-Occupied | 203 (82.5%) | $77,688 |
| Renter-Occupied | 43 (17.5%) | $33,750 |
| Average | 246 (100.0%) | $73,125 |
Occupancy by Householder Income Bracket in Hayesville
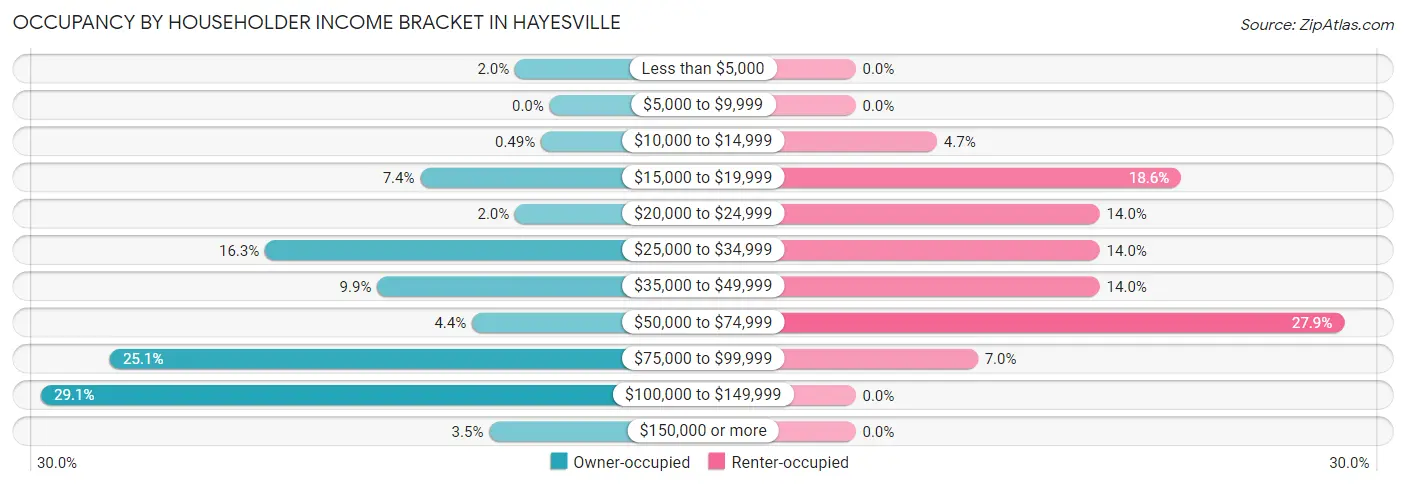
| Income Bracket | Owner-occupied | Renter-occupied |
| Less than $5,000 | 4 (2.0%) | 0 (0.0%) |
| $5,000 to $9,999 | 0 (0.0%) | 0 (0.0%) |
| $10,000 to $14,999 | 1 (0.5%) | 2 (4.6%) |
| $15,000 to $19,999 | 15 (7.4%) | 8 (18.6%) |
| $20,000 to $24,999 | 4 (2.0%) | 6 (14.0%) |
| $25,000 to $34,999 | 33 (16.3%) | 6 (14.0%) |
| $35,000 to $49,999 | 20 (9.9%) | 6 (14.0%) |
| $50,000 to $74,999 | 9 (4.4%) | 12 (27.9%) |
| $75,000 to $99,999 | 51 (25.1%) | 3 (7.0%) |
| $100,000 to $149,999 | 59 (29.1%) | 0 (0.0%) |
| $150,000 or more | 7 (3.5%) | 0 (0.0%) |
| Total | 203 (100.0%) | 43 (100.0%) |
Monthly Housing Cost Tiers in Hayesville
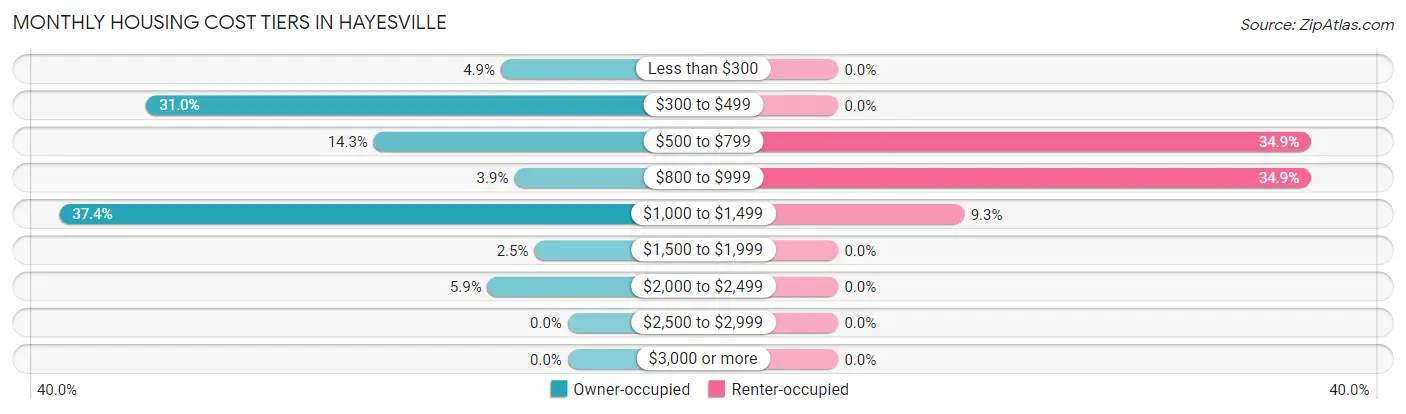
| Monthly Cost | Owner-occupied | Renter-occupied |
| Less than $300 | 10 (4.9%) | 0 (0.0%) |
| $300 to $499 | 63 (31.0%) | 0 (0.0%) |
| $500 to $799 | 29 (14.3%) | 15 (34.9%) |
| $800 to $999 | 8 (3.9%) | 15 (34.9%) |
| $1,000 to $1,499 | 76 (37.4%) | 4 (9.3%) |
| $1,500 to $1,999 | 5 (2.5%) | 0 (0.0%) |
| $2,000 to $2,499 | 12 (5.9%) | 0 (0.0%) |
| $2,500 to $2,999 | 0 (0.0%) | 0 (0.0%) |
| $3,000 or more | 0 (0.0%) | 0 (0.0%) |
| Total | 203 (100.0%) | 43 (100.0%) |
Physical Housing Characteristics in Hayesville
Housing Structures in Hayesville
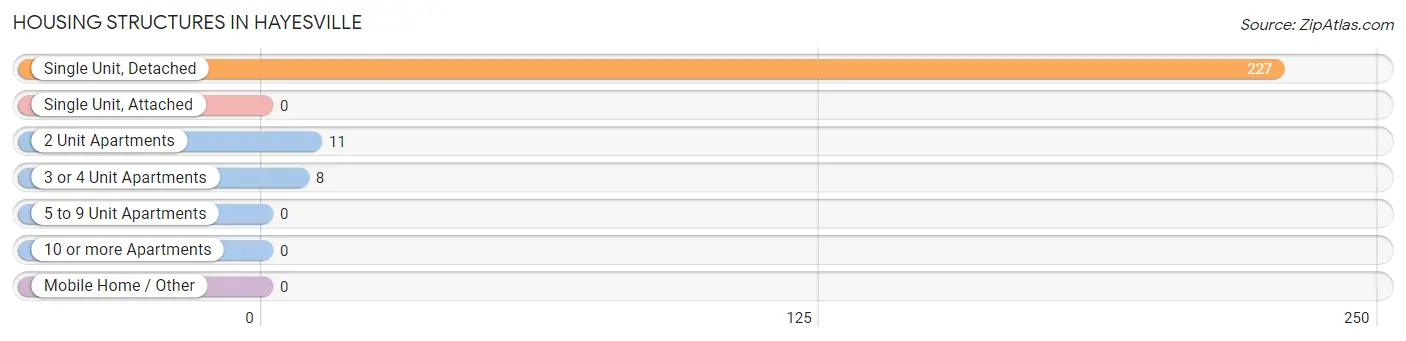
| Structure Type | # Housing Units | % Housing Units |
| Single Unit, Detached | 227 | 92.3% |
| Single Unit, Attached | 0 | 0.0% |
| 2 Unit Apartments | 11 | 4.5% |
| 3 or 4 Unit Apartments | 8 | 3.3% |
| 5 to 9 Unit Apartments | 0 | 0.0% |
| 10 or more Apartments | 0 | 0.0% |
| Mobile Home / Other | 0 | 0.0% |
| Total | 246 | 100.0% |
Housing Structures by Occupancy in Hayesville
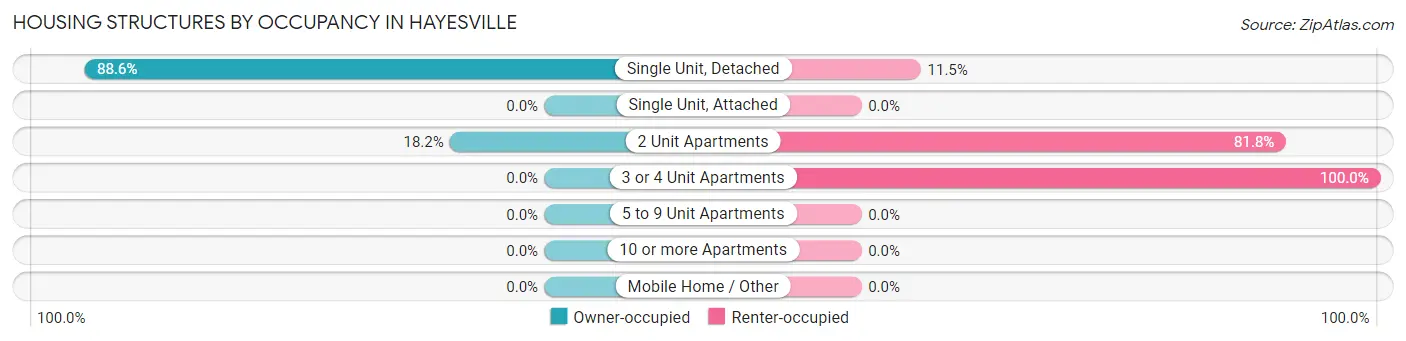
| Structure Type | Owner-occupied | Renter-occupied |
| Single Unit, Detached | 201 (88.5%) | 26 (11.5%) |
| Single Unit, Attached | 0 (0.0%) | 0 (0.0%) |
| 2 Unit Apartments | 2 (18.2%) | 9 (81.8%) |
| 3 or 4 Unit Apartments | 0 (0.0%) | 8 (100.0%) |
| 5 to 9 Unit Apartments | 0 (0.0%) | 0 (0.0%) |
| 10 or more Apartments | 0 (0.0%) | 0 (0.0%) |
| Mobile Home / Other | 0 (0.0%) | 0 (0.0%) |
| Total | 203 (82.5%) | 43 (17.5%) |
Housing Structures by Number of Rooms in Hayesville
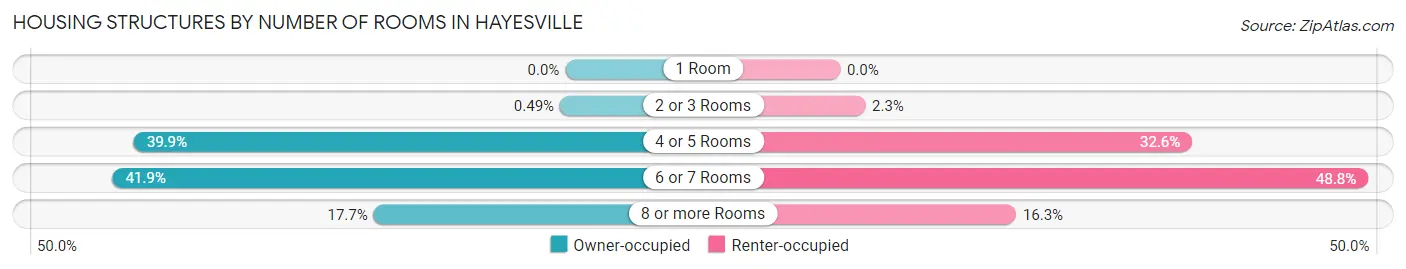
| Number of Rooms | Owner-occupied | Renter-occupied |
| 1 Room | 0 (0.0%) | 0 (0.0%) |
| 2 or 3 Rooms | 1 (0.5%) | 1 (2.3%) |
| 4 or 5 Rooms | 81 (39.9%) | 14 (32.6%) |
| 6 or 7 Rooms | 85 (41.9%) | 21 (48.8%) |
| 8 or more Rooms | 36 (17.7%) | 7 (16.3%) |
| Total | 203 (100.0%) | 43 (100.0%) |
Housing Structure by Heating Type in Hayesville
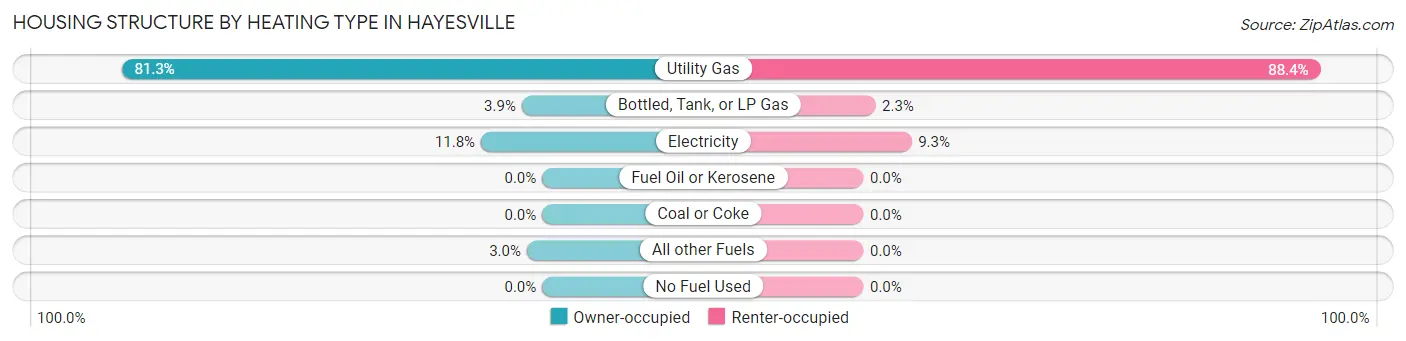
| Heating Type | Owner-occupied | Renter-occupied |
| Utility Gas | 165 (81.3%) | 38 (88.4%) |
| Bottled, Tank, or LP Gas | 8 (3.9%) | 1 (2.3%) |
| Electricity | 24 (11.8%) | 4 (9.3%) |
| Fuel Oil or Kerosene | 0 (0.0%) | 0 (0.0%) |
| Coal or Coke | 0 (0.0%) | 0 (0.0%) |
| All other Fuels | 6 (3.0%) | 0 (0.0%) |
| No Fuel Used | 0 (0.0%) | 0 (0.0%) |
| Total | 203 (100.0%) | 43 (100.0%) |
Household Vehicle Usage in Hayesville
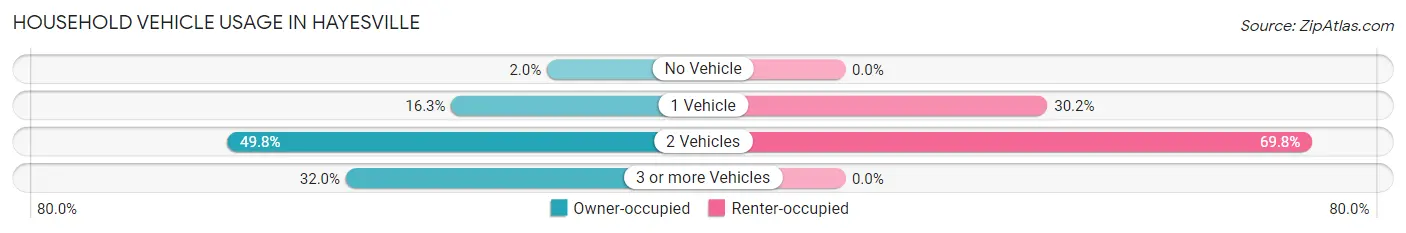
| Vehicles per Household | Owner-occupied | Renter-occupied |
| No Vehicle | 4 (2.0%) | 0 (0.0%) |
| 1 Vehicle | 33 (16.3%) | 13 (30.2%) |
| 2 Vehicles | 101 (49.7%) | 30 (69.8%) |
| 3 or more Vehicles | 65 (32.0%) | 0 (0.0%) |
| Total | 203 (100.0%) | 43 (100.0%) |
Real Estate & Mortgages in Hayesville
Real Estate and Mortgage Overview in Hayesville
| Characteristic | Without Mortgage | With Mortgage |
| Housing Units | 81 | 122 |
| Median Property Value | $141,000 | $137,800 |
| Median Household Income | $32,313 | $7 |
| Monthly Housing Costs | $376 | $0 |
| Real Estate Taxes | $1,158 | $0 |
Property Value by Mortgage Status in Hayesville
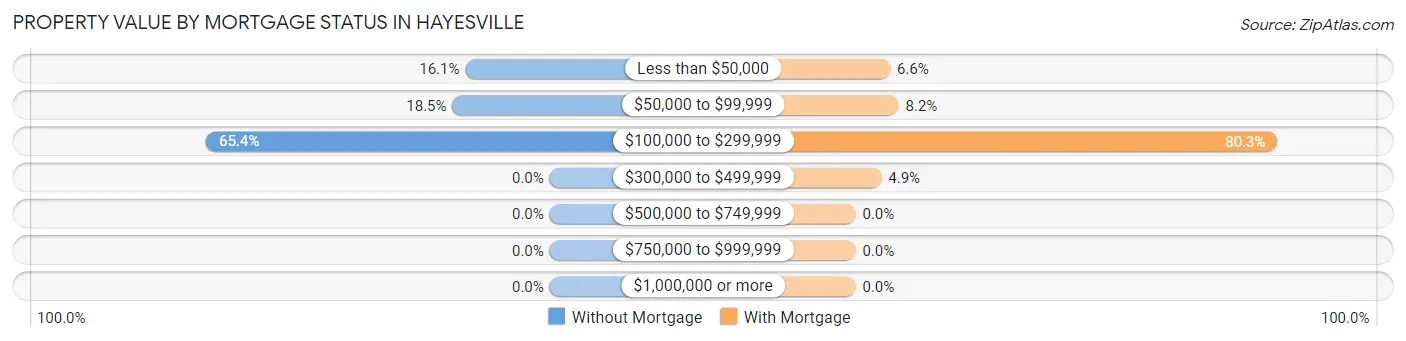
| Property Value | Without Mortgage | With Mortgage |
| Less than $50,000 | 13 (16.1%) | 8 (6.6%) |
| $50,000 to $99,999 | 15 (18.5%) | 10 (8.2%) |
| $100,000 to $299,999 | 53 (65.4%) | 98 (80.3%) |
| $300,000 to $499,999 | 0 (0.0%) | 6 (4.9%) |
| $500,000 to $749,999 | 0 (0.0%) | 0 (0.0%) |
| $750,000 to $999,999 | 0 (0.0%) | 0 (0.0%) |
| $1,000,000 or more | 0 (0.0%) | 0 (0.0%) |
| Total | 81 (100.0%) | 122 (100.0%) |
Household Income by Mortgage Status in Hayesville
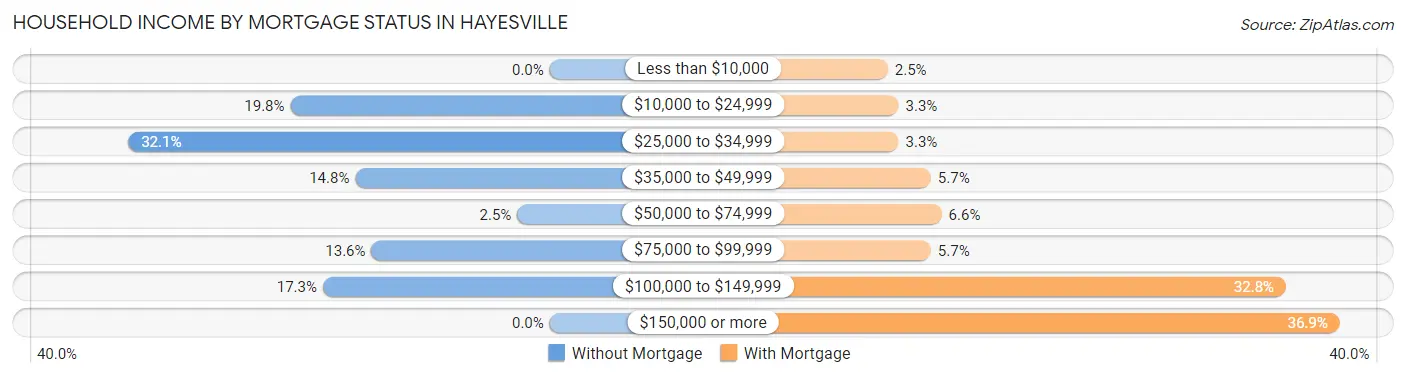
| Household Income | Without Mortgage | With Mortgage |
| Less than $10,000 | 0 (0.0%) | 3 (2.5%) |
| $10,000 to $24,999 | 16 (19.8%) | 4 (3.3%) |
| $25,000 to $34,999 | 26 (32.1%) | 4 (3.3%) |
| $35,000 to $49,999 | 12 (14.8%) | 7 (5.7%) |
| $50,000 to $74,999 | 2 (2.5%) | 8 (6.6%) |
| $75,000 to $99,999 | 11 (13.6%) | 7 (5.7%) |
| $100,000 to $149,999 | 14 (17.3%) | 40 (32.8%) |
| $150,000 or more | 0 (0.0%) | 45 (36.9%) |
| Total | 81 (100.0%) | 122 (100.0%) |
Property Value to Household Income Ratio in Hayesville
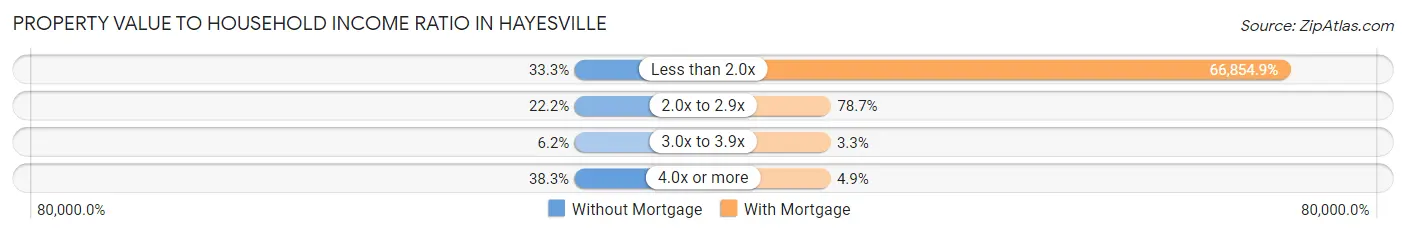
| Value-to-Income Ratio | Without Mortgage | With Mortgage |
| Less than 2.0x | 27 (33.3%) | 81,563 (66,854.9%) |
| 2.0x to 2.9x | 18 (22.2%) | 96 (78.7%) |
| 3.0x to 3.9x | 5 (6.2%) | 4 (3.3%) |
| 4.0x or more | 31 (38.3%) | 6 (4.9%) |
| Total | 81 (100.0%) | 122 (100.0%) |
Real Estate Taxes by Mortgage Status in Hayesville
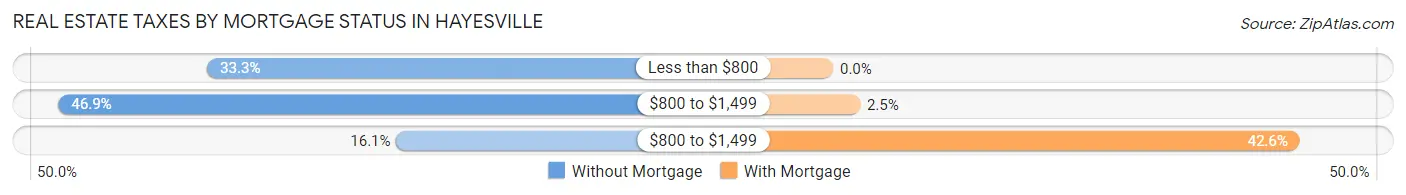
| Property Taxes | Without Mortgage | With Mortgage |
| Less than $800 | 27 (33.3%) | 0 (0.0%) |
| $800 to $1,499 | 38 (46.9%) | 3 (2.5%) |
| $800 to $1,499 | 13 (16.1%) | 52 (42.6%) |
| Total | 81 (100.0%) | 122 (100.0%) |
Health & Disability in Hayesville
Health Insurance Coverage by Age in Hayesville
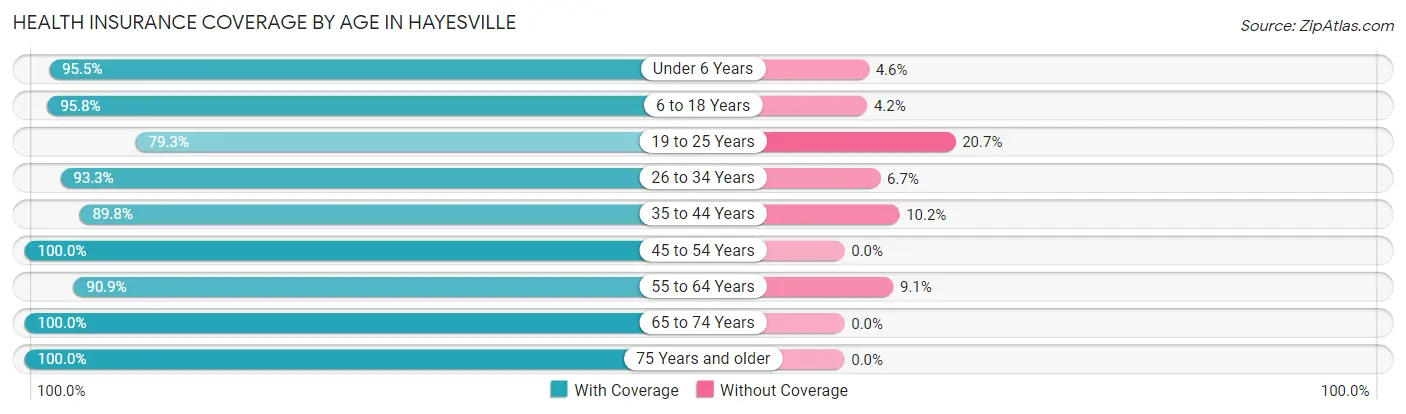
| Age Bracket | With Coverage | Without Coverage |
| Under 6 Years | 21 (95.5%) | 1 (4.5%) |
| 6 to 18 Years | 136 (95.8%) | 6 (4.2%) |
| 19 to 25 Years | 23 (79.3%) | 6 (20.7%) |
| 26 to 34 Years | 84 (93.3%) | 6 (6.7%) |
| 35 to 44 Years | 114 (89.8%) | 13 (10.2%) |
| 45 to 54 Years | 29 (100.0%) | 0 (0.0%) |
| 55 to 64 Years | 40 (90.9%) | 4 (9.1%) |
| 65 to 74 Years | 69 (100.0%) | 0 (0.0%) |
| 75 Years and older | 47 (100.0%) | 0 (0.0%) |
| Total | 563 (94.0%) | 36 (6.0%) |
Health Insurance Coverage by Citizenship Status in Hayesville
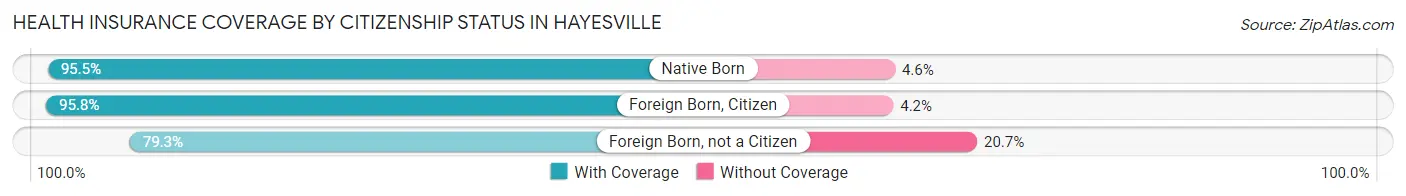
| Citizenship Status | With Coverage | Without Coverage |
| Native Born | 21 (95.5%) | 1 (4.5%) |
| Foreign Born, Citizen | 136 (95.8%) | 6 (4.2%) |
| Foreign Born, not a Citizen | 23 (79.3%) | 6 (20.7%) |
Health Insurance Coverage by Household Income in Hayesville
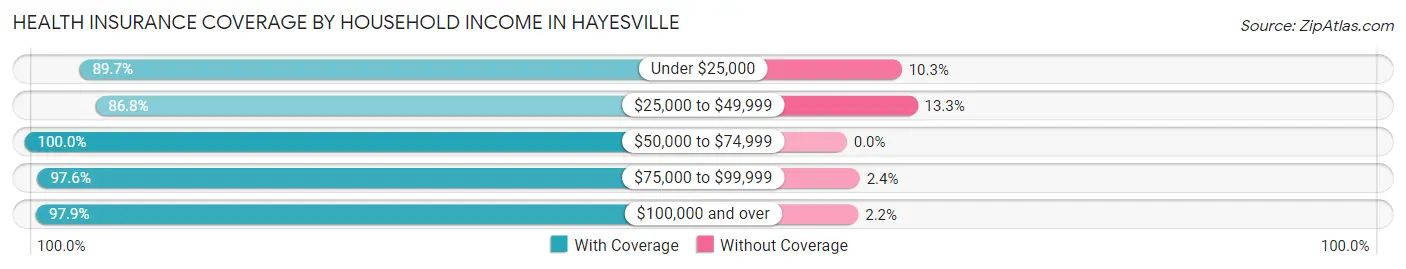
| Household Income | With Coverage | Without Coverage |
| Under $25,000 | 61 (89.7%) | 7 (10.3%) |
| $25,000 to $49,999 | 144 (86.8%) | 22 (13.3%) |
| $50,000 to $74,999 | 55 (100.0%) | 0 (0.0%) |
| $75,000 to $99,999 | 121 (97.6%) | 3 (2.4%) |
| $100,000 and over | 182 (97.9%) | 4 (2.1%) |
Public vs Private Health Insurance Coverage by Age in Hayesville
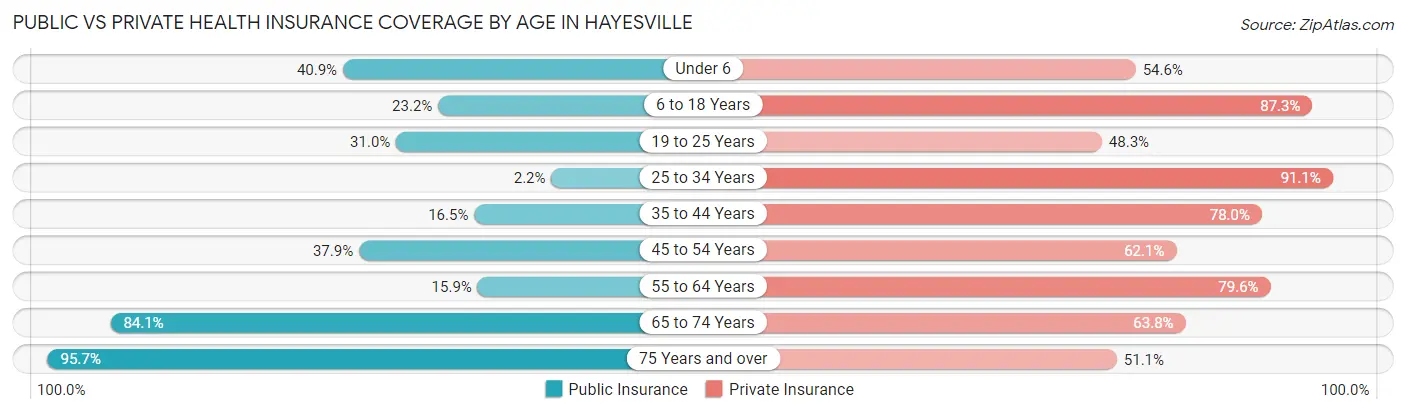
| Age Bracket | Public Insurance | Private Insurance |
| Under 6 | 9 (40.9%) | 12 (54.5%) |
| 6 to 18 Years | 33 (23.2%) | 124 (87.3%) |
| 19 to 25 Years | 9 (31.0%) | 14 (48.3%) |
| 25 to 34 Years | 2 (2.2%) | 82 (91.1%) |
| 35 to 44 Years | 21 (16.5%) | 99 (77.9%) |
| 45 to 54 Years | 11 (37.9%) | 18 (62.1%) |
| 55 to 64 Years | 7 (15.9%) | 35 (79.5%) |
| 65 to 74 Years | 58 (84.1%) | 44 (63.8%) |
| 75 Years and over | 45 (95.7%) | 24 (51.1%) |
| Total | 195 (32.6%) | 452 (75.5%) |
Disability Status by Sex by Age in Hayesville
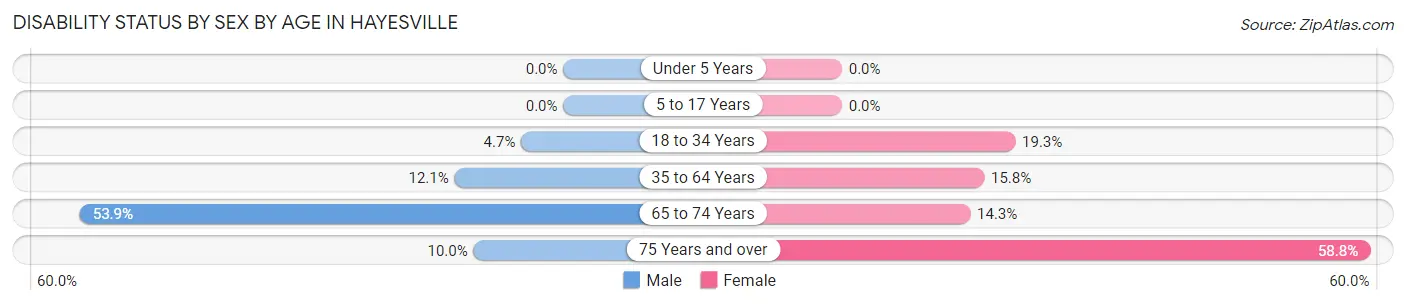
| Age Bracket | Male | Female |
| Under 5 Years | 0 (0.0%) | 0 (0.0%) |
| 5 to 17 Years | 0 (0.0%) | 0 (0.0%) |
| 18 to 34 Years | 3 (4.7%) | 11 (19.3%) |
| 35 to 64 Years | 12 (12.1%) | 16 (15.8%) |
| 65 to 74 Years | 7 (53.8%) | 8 (14.3%) |
| 75 Years and over | 3 (10.0%) | 10 (58.8%) |
Disability Class by Sex by Age in Hayesville
Disability Class: Hearing Difficulty
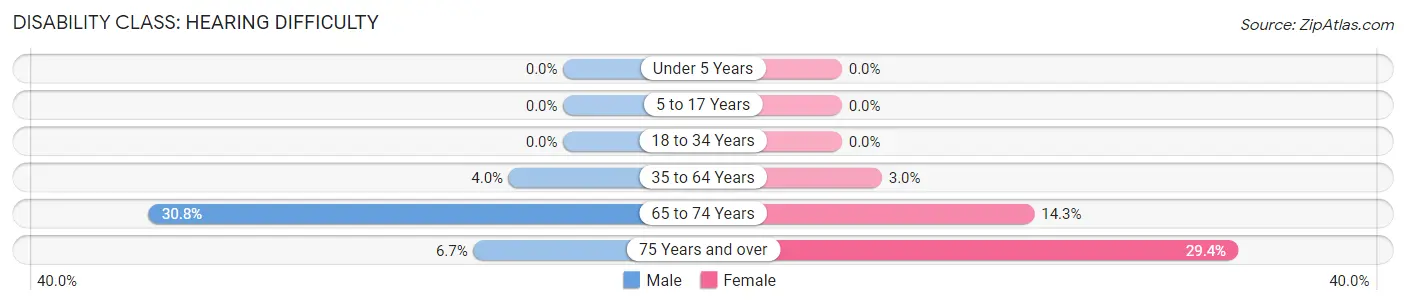
| Age Bracket | Male | Female |
| Under 5 Years | 0 (0.0%) | 0 (0.0%) |
| 5 to 17 Years | 0 (0.0%) | 0 (0.0%) |
| 18 to 34 Years | 0 (0.0%) | 0 (0.0%) |
| 35 to 64 Years | 4 (4.0%) | 3 (3.0%) |
| 65 to 74 Years | 4 (30.8%) | 8 (14.3%) |
| 75 Years and over | 2 (6.7%) | 5 (29.4%) |
Disability Class: Vision Difficulty
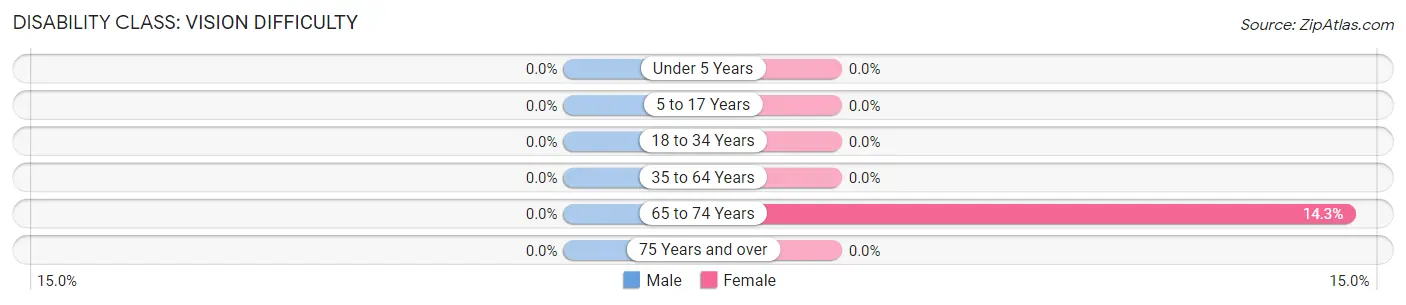
| Age Bracket | Male | Female |
| Under 5 Years | 0 (0.0%) | 0 (0.0%) |
| 5 to 17 Years | 0 (0.0%) | 0 (0.0%) |
| 18 to 34 Years | 0 (0.0%) | 0 (0.0%) |
| 35 to 64 Years | 0 (0.0%) | 0 (0.0%) |
| 65 to 74 Years | 0 (0.0%) | 8 (14.3%) |
| 75 Years and over | 0 (0.0%) | 0 (0.0%) |
Disability Class: Cognitive Difficulty
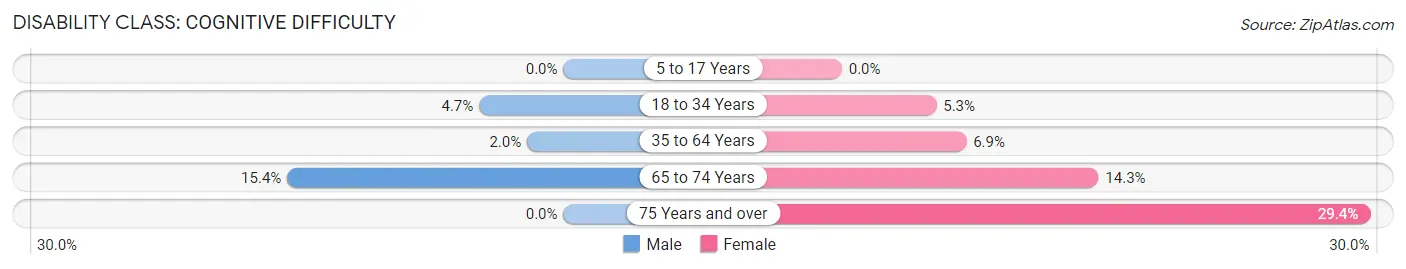
| Age Bracket | Male | Female |
| 5 to 17 Years | 0 (0.0%) | 0 (0.0%) |
| 18 to 34 Years | 3 (4.7%) | 3 (5.3%) |
| 35 to 64 Years | 2 (2.0%) | 7 (6.9%) |
| 65 to 74 Years | 2 (15.4%) | 8 (14.3%) |
| 75 Years and over | 0 (0.0%) | 5 (29.4%) |
Disability Class: Ambulatory Difficulty
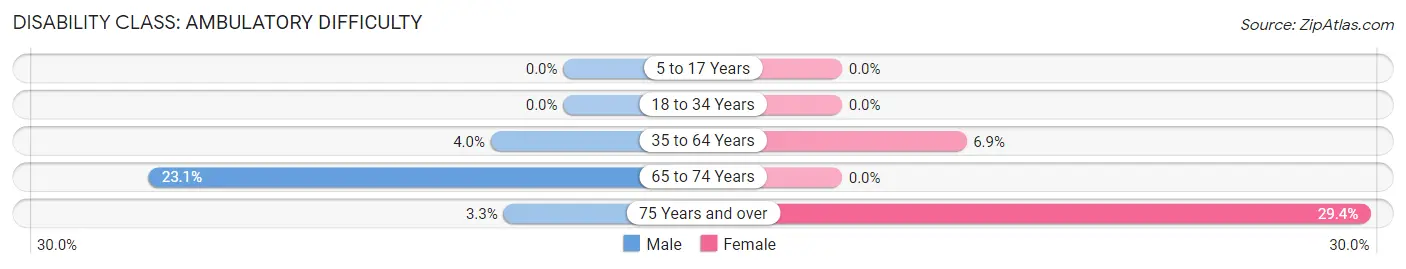
| Age Bracket | Male | Female |
| 5 to 17 Years | 0 (0.0%) | 0 (0.0%) |
| 18 to 34 Years | 0 (0.0%) | 0 (0.0%) |
| 35 to 64 Years | 4 (4.0%) | 7 (6.9%) |
| 65 to 74 Years | 3 (23.1%) | 0 (0.0%) |
| 75 Years and over | 1 (3.3%) | 5 (29.4%) |
Disability Class: Self-Care Difficulty
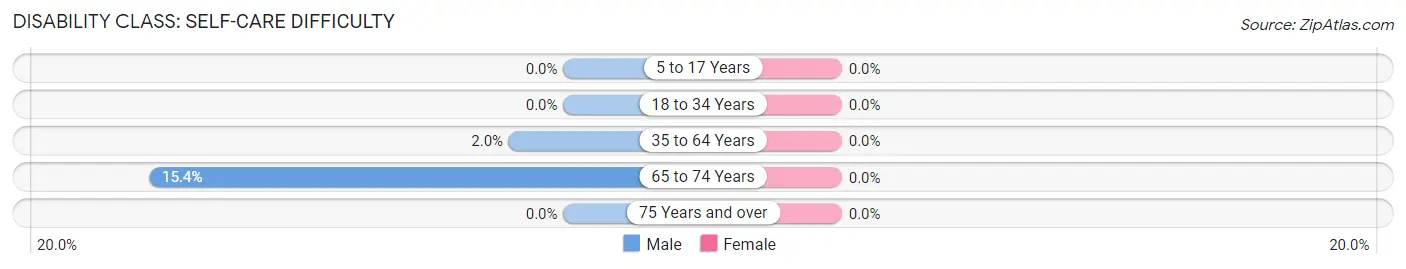
| Age Bracket | Male | Female |
| 5 to 17 Years | 0 (0.0%) | 0 (0.0%) |
| 18 to 34 Years | 0 (0.0%) | 0 (0.0%) |
| 35 to 64 Years | 2 (2.0%) | 0 (0.0%) |
| 65 to 74 Years | 2 (15.4%) | 0 (0.0%) |
| 75 Years and over | 0 (0.0%) | 0 (0.0%) |
Technology Access in Hayesville
Computing Device Access in Hayesville
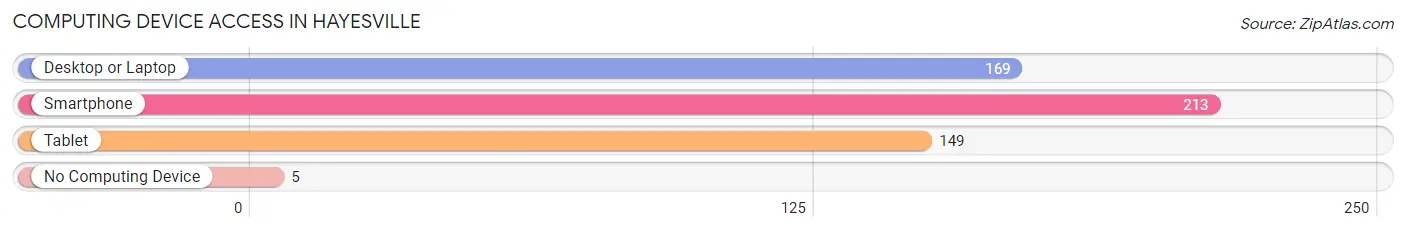
| Device Type | # Households | % Households |
| Desktop or Laptop | 169 | 68.7% |
| Smartphone | 213 | 86.6% |
| Tablet | 149 | 60.6% |
| No Computing Device | 5 | 2.0% |
| Total | 246 | 100.0% |
Internet Access in Hayesville
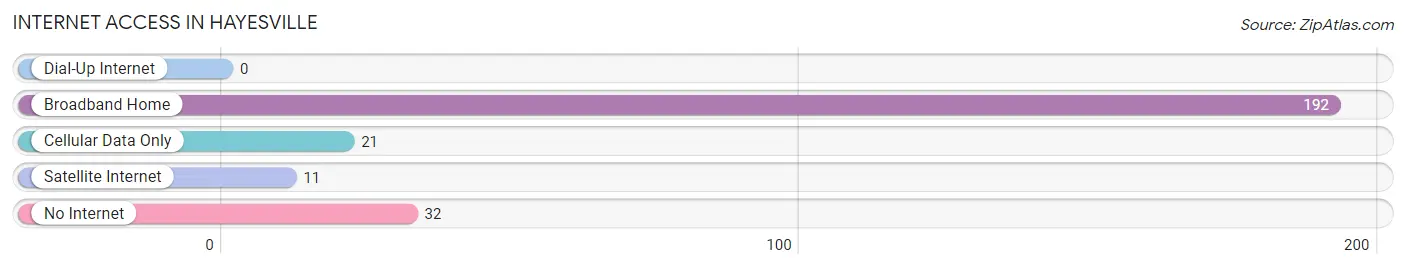
| Internet Type | # Households | % Households |
| Dial-Up Internet | 0 | 0.0% |
| Broadband Home | 192 | 78.0% |
| Cellular Data Only | 21 | 8.5% |
| Satellite Internet | 11 | 4.5% |
| No Internet | 32 | 13.0% |
| Total | 246 | 100.0% |
Hayesville Summary
Hayesville, Ohio is a small village located in the northeastern corner of Ashland County, Ohio. It is situated on the banks of the Mohican River, and is surrounded by rolling hills and lush forests. The village has a population of approximately 1,000 people, and is home to a variety of businesses, including a grocery store, a hardware store, a bank, and a few restaurants.
History
The area that is now Hayesville was first settled in 1812 by a group of settlers from Pennsylvania. The village was originally known as “Haysville”, and was named after the first settler, John Hays. The village was officially incorporated in 1837, and the name was changed to “Hayesville”.
The village grew slowly over the years, and by the early 1900s, it had become a thriving community. The village was home to several businesses, including a sawmill, a grist mill, a blacksmith shop, and a general store. The village also had a post office, a school, and a church.
In the late 1800s, the village was connected to the outside world by the Cleveland, Akron, and Columbus Railroad. This allowed the village to become more connected to the outside world, and allowed for the growth of the village.
Geography
Hayesville is located in the northeastern corner of Ashland County, Ohio. It is situated on the banks of the Mohican River, and is surrounded by rolling hills and lush forests. The village is located approximately 25 miles south of Cleveland, and is about an hour’s drive from Akron and Columbus.
The village is located in a rural area, and is surrounded by farmland. The village is also located near several state parks, including Mohican State Park, Malabar Farm State Park, and Clear Fork State Park.
Economy
The economy of Hayesville is largely based on agriculture and tourism. The village is home to several farms, and the surrounding area is home to many dairy farms. The village is also home to several businesses, including a grocery store, a hardware store, a bank, and a few restaurants.
The village is also home to several tourist attractions, including the Mohican State Park, Malabar Farm State Park, and Clear Fork State Park. These parks attract visitors from all over the state, and provide a boost to the local economy.
Demographics
As of the 2010 census, the population of Hayesville was 1,000 people. The village is predominantly white, with 95.2% of the population being white. The remaining 4.8% of the population is made up of African Americans, Hispanics, and other races.
The median household income in Hayesville is $41,250, and the median home value is $117,000. The village has a low unemployment rate, and the poverty rate is below the national average.
Overall, Hayesville is a small, rural village with a strong sense of community. The village is home to a variety of businesses, and is surrounded by beautiful scenery. The village is a great place to live, work, and raise a family.
Common Questions
What is Per Capita Income in Hayesville?
Per Capita income in Hayesville is $28,009.
What is the Median Family Income in Hayesville?
Median Family Income in Hayesville is $76,607.
What is the Median Household income in Hayesville?
Median Household Income in Hayesville is $73,125.
What is Income or Wage Gap in Hayesville?
Income or Wage Gap in Hayesville is 35.7%.
Women in Hayesville earn 64.3 cents for every dollar earned by a man.
What is Inequality or Gini Index in Hayesville?
Inequality or Gini Index in Hayesville is 0.35.
What is the Total Population of Hayesville?
Total Population of Hayesville is 599.
What is the Total Male Population of Hayesville?
Total Male Population of Hayesville is 255.
What is the Total Female Population of Hayesville?
Total Female Population of Hayesville is 344.
What is the Ratio of Males per 100 Females in Hayesville?
There are 74.13 Males per 100 Females in Hayesville.
What is the Ratio of Females per 100 Males in Hayesville?
There are 134.90 Females per 100 Males in Hayesville.
What is the Median Population Age in Hayesville?
Median Population Age in Hayesville is 37.1 Years.
What is the Average Family Size in Hayesville
Average Family Size in Hayesville is 2.7 People.
What is the Average Household Size in Hayesville
Average Household Size in Hayesville is 2.4 People.
How Large is the Labor Force in Hayesville?
There are 294 People in the Labor Forcein in Hayesville.
What is the Percentage of People in the Labor Force in Hayesville?
64.3% of People are in the Labor Force in Hayesville.
What is the Unemployment Rate in Hayesville?
Unemployment Rate in Hayesville is 3.4%.