Zip Codes with the Highest Percentage of Population Employed in Community & Social Service in Kent, OH
RELATED REPORTS & OPTIONS
Community & Social Service
Kent
Compare Zip Codes
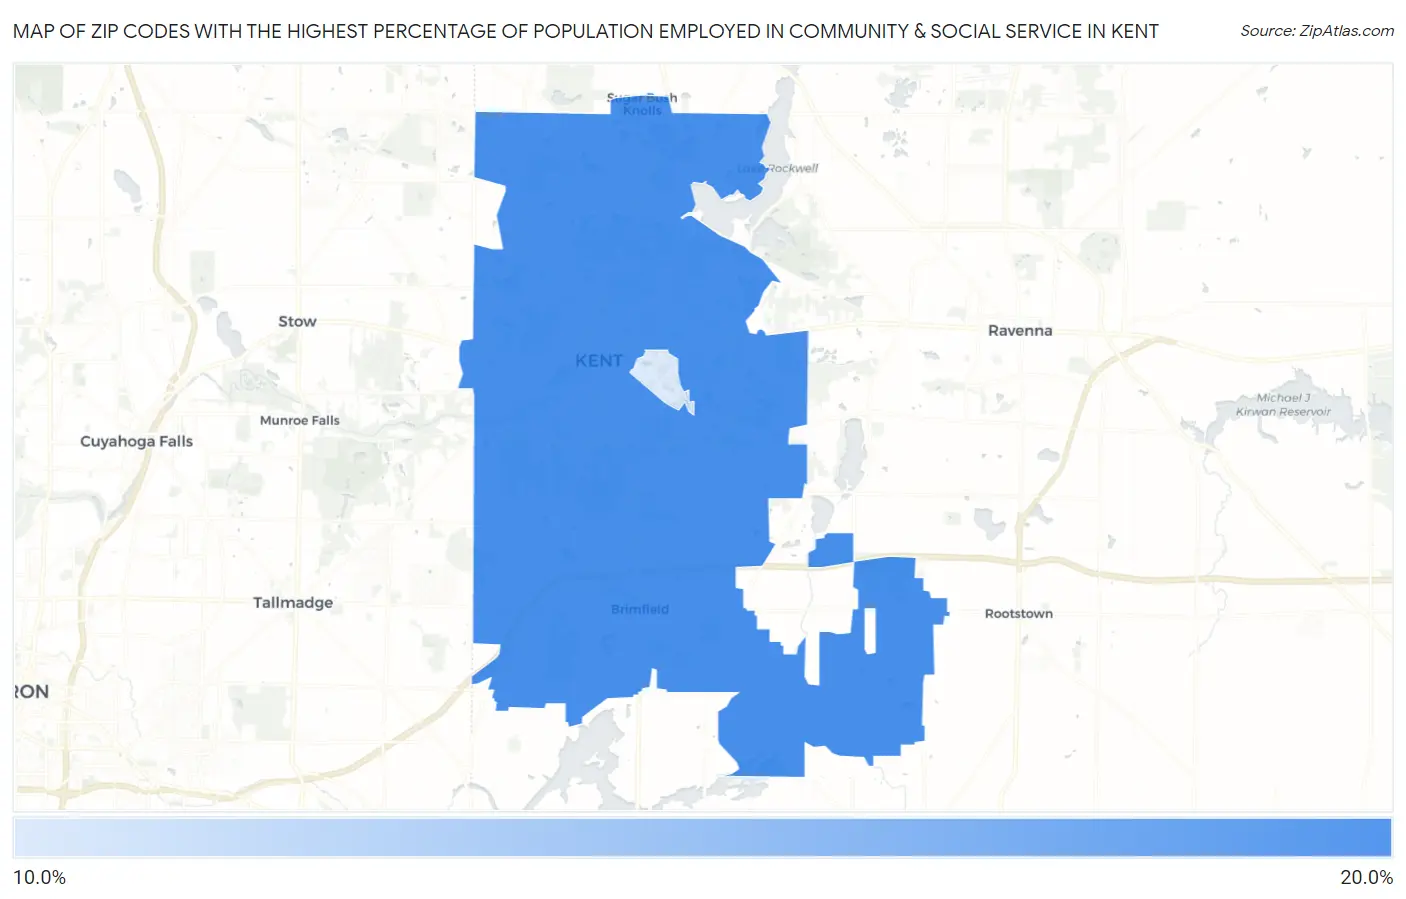
Map of Zip Codes with the Highest Percentage of Population Employed in Community & Social Service in Kent
11.6%
15.6%
Zip Codes with the Highest Percentage of Population Employed in Community & Social Service in Kent, OH
| Zip Code | % Employed | vs State | vs National | |
| 1. | 44240 | 15.6% | 10.0%(+5.68)#93 | 11.2%(+4.42)#4,391 |
| 2. | 44243 | 11.6% | 10.0%(+1.62)#254 | 11.2%(+0.365)#10,276 |
1
Common Questions
What are the Top Zip Codes with the Highest Percentage of Population Employed in Community & Social Service in Kent, OH?
Top Zip Codes with the Highest Percentage of Population Employed in Community & Social Service in Kent, OH are:
What zip code has the Highest Percentage of Population Employed in Community & Social Service in Kent, OH?
44240 has the Highest Percentage of Population Employed in Community & Social Service in Kent, OH with 15.6%.
What is the Percentage of Population Employed in Community & Social Service in Kent, OH?
Percentage of Population Employed in Community & Social Service in Kent is 16.0%.
What is the Percentage of Population Employed in Community & Social Service in Ohio?
Percentage of Population Employed in Community & Social Service in Ohio is 10.0%.
What is the Percentage of Population Employed in Community & Social Service in the United States?
Percentage of Population Employed in Community & Social Service in the United States is 11.2%.