Zip Codes with the Highest Percentage of Households with Income Above $100,000 in Dayton, OH
RELATED REPORTS & OPTIONS
Household Income | $100k+
Dayton
Compare Zip Codes
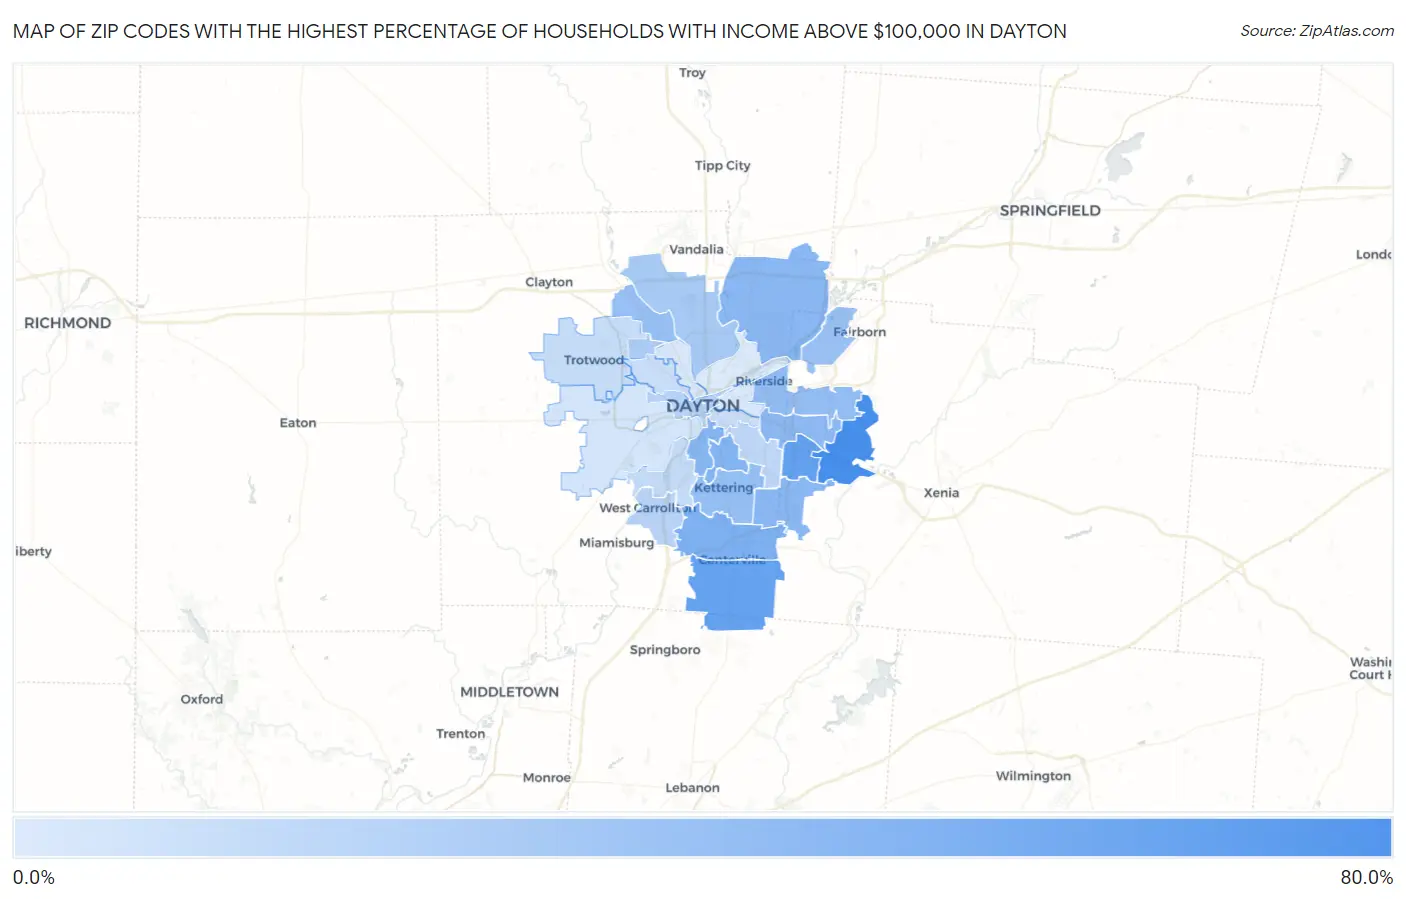
Map of Zip Codes with the Highest Percentage of Households with Income Above $100,000 in Dayton
7.6%
68.3%
Zip Codes with the Highest Percentage of Households with Income Above $100,000 in Dayton, OH
| Zip Code | Households with Income > $100k | vs State | vs National | |
| 1. | 45434 | 68.3% | 31.5%(+36.8)#19 | 37.3%(+31.0)#1,129 |
| 2. | 45430 | 54.8% | 31.5%(+23.3)#65 | 37.3%(+17.5)#3,510 |
| 3. | 45458 | 53.4% | 31.5%(+21.9)#72 | 37.3%(+16.1)#3,852 |
| 4. | 45459 | 42.9% | 31.5%(+11.4)#189 | 37.3%(+5.60)#7,479 |
| 5. | 45419 | 40.8% | 31.5%(+9.30)#229 | 37.3%(+3.50)#8,516 |
| 6. | 45409 | 39.1% | 31.5%(+7.60)#268 | 37.3%(+1.80)#9,372 |
| 7. | 45440 | 38.1% | 31.5%(+6.60)#282 | 37.3%(+0.800)#9,926 |
| 8. | 45424 | 37.4% | 31.5%(+5.90)#296 | 37.3%(+0.100)#10,320 |
| 9. | 45432 | 36.6% | 31.5%(+5.10)#312 | 37.3%(-0.700)#10,821 |
| 10. | 45431 | 34.5% | 31.5%(+3.00)#372 | 37.3%(-2.80)#12,073 |
| 11. | 45429 | 33.4% | 31.5%(+1.90)#403 | 37.3%(-3.90)#12,819 |
| 12. | 45415 | 32.1% | 31.5%(+0.600)#445 | 37.3%(-5.20)#13,775 |
| 13. | 45433 | 31.2% | 31.5%(-0.300)#476 | 37.3%(-6.10)#14,508 |
| 14. | 45414 | 26.1% | 31.5%(-5.40)#654 | 37.3%(-11.2)#18,785 |
| 15. | 45416 | 24.7% | 31.5%(-6.80)#719 | 37.3%(-12.6)#20,030 |
| 16. | 45449 | 20.3% | 31.5%(-11.2)#859 | 37.3%(-17.0)#23,796 |
| 17. | 45402 | 20.3% | 31.5%(-11.2)#860 | 37.3%(-17.0)#23,807 |
| 18. | 45420 | 18.5% | 31.5%(-13.0)#919 | 37.3%(-18.8)#25,177 |
| 19. | 45439 | 16.3% | 31.5%(-15.2)#975 | 37.3%(-21.0)#26,715 |
| 20. | 45426 | 15.6% | 31.5%(-15.9)#996 | 37.3%(-21.7)#27,177 |
| 21. | 45406 | 14.3% | 31.5%(-17.2)#1,028 | 37.3%(-23.0)#27,932 |
| 22. | 45410 | 13.5% | 31.5%(-18.0)#1,046 | 37.3%(-23.8)#28,348 |
| 23. | 45417 | 10.8% | 31.5%(-20.7)#1,082 | 37.3%(-26.5)#29,521 |
| 24. | 45405 | 9.3% | 31.5%(-22.2)#1,099 | 37.3%(-28.0)#30,046 |
| 25. | 45403 | 8.7% | 31.5%(-22.8)#1,107 | 37.3%(-28.6)#30,230 |
| 26. | 45404 | 7.6% | 31.5%(-23.9)#1,127 | 37.3%(-29.7)#30,535 |
1
Common Questions
What are the Top 10 Zip Codes with the Highest Percentage of Households with Income Above $100,000 in Dayton, OH?
Top 10 Zip Codes with the Highest Percentage of Households with Income Above $100,000 in Dayton, OH are:
What zip code has the Highest Percentage of Households with Income Above $100,000 in Dayton, OH?
45434 has the Highest Percentage of Households with Income Above $100,000 in Dayton, OH with 68.3%.
What is the Percentage of Households with Income Above $100,000 in Dayton, OH?
Percentage of Households with Income Above $100,000 in Dayton is 15.0%.
What is the Percentage of Households with Income Above $100,000 in Ohio?
Percentage of Households with Income Above $100,000 in Ohio is 31.5%.
What is the Percentage of Households with Income Above $100,000 in the United States?
Percentage of Households with Income Above $100,000 in the United States is 37.3%.