Zip Codes with the Highest Percentage of Households with Income Above $100,000 in Steubenville, OH
RELATED REPORTS & OPTIONS
Household Income | $100k+
Steubenville
Compare Zip Codes
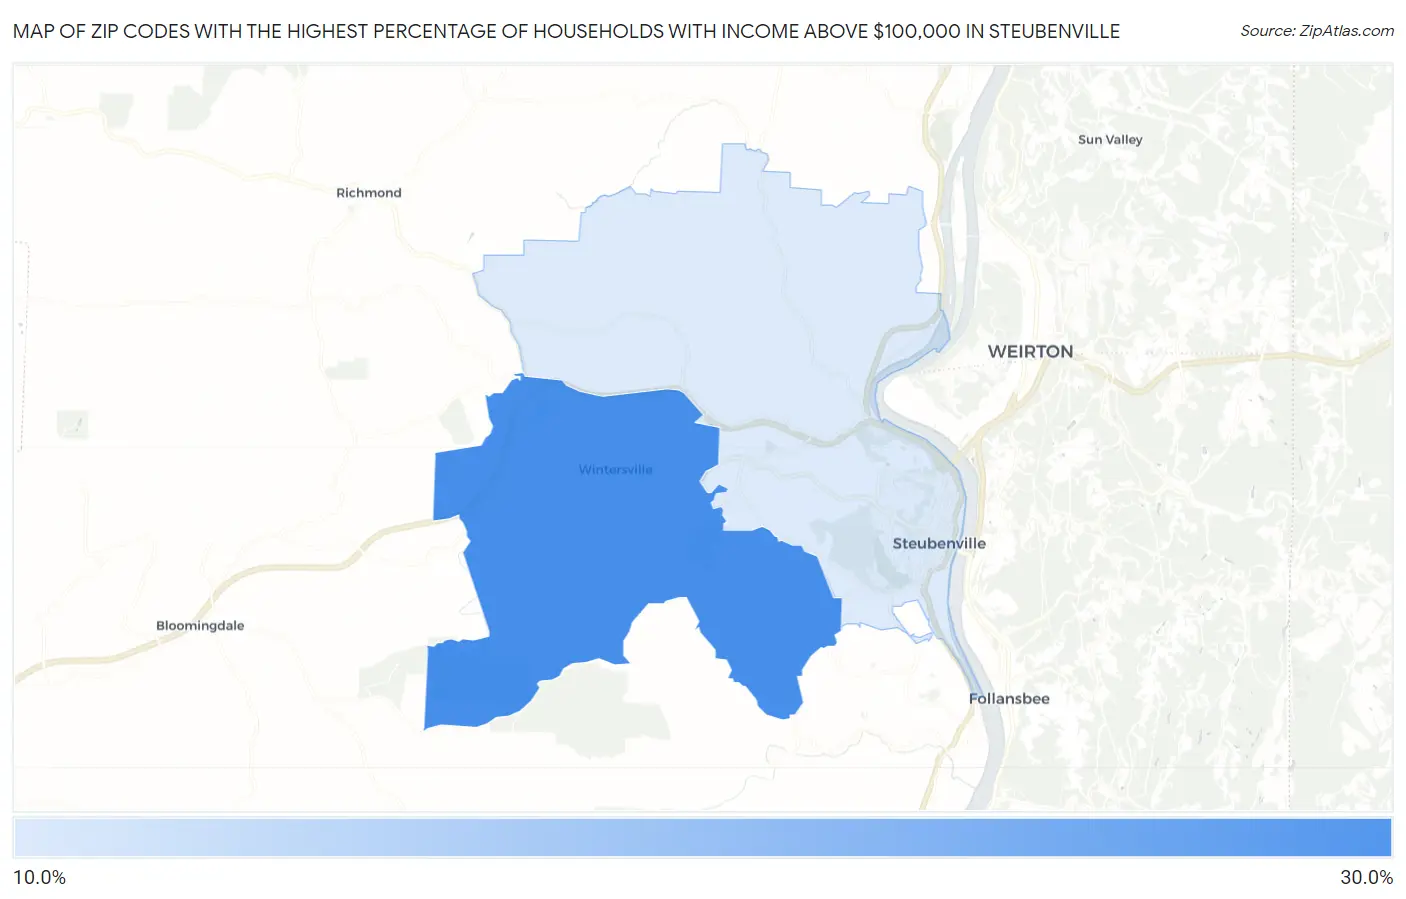
Map of Zip Codes with the Highest Percentage of Households with Income Above $100,000 in Steubenville
18.4%
27.9%
Zip Codes with the Highest Percentage of Households with Income Above $100,000 in Steubenville, OH
| Zip Code | Households with Income > $100k | vs State | vs National | |
| 1. | 43953 | 27.9% | 31.5%(-3.60)#592 | 37.3%(-9.40)#17,219 |
| 2. | 43952 | 18.4% | 31.5%(-13.1)#921 | 37.3%(-18.9)#25,263 |
1
Common Questions
What are the Top Zip Codes with the Highest Percentage of Households with Income Above $100,000 in Steubenville, OH?
Top Zip Codes with the Highest Percentage of Households with Income Above $100,000 in Steubenville, OH are:
What zip code has the Highest Percentage of Households with Income Above $100,000 in Steubenville, OH?
43953 has the Highest Percentage of Households with Income Above $100,000 in Steubenville, OH with 27.9%.
What is the Percentage of Households with Income Above $100,000 in Steubenville, OH?
Percentage of Households with Income Above $100,000 in Steubenville is 16.7%.
What is the Percentage of Households with Income Above $100,000 in Ohio?
Percentage of Households with Income Above $100,000 in Ohio is 31.5%.
What is the Percentage of Households with Income Above $100,000 in the United States?
Percentage of Households with Income Above $100,000 in the United States is 37.3%.