Zip Codes with the Highest Percentage of Households with Income Above $100,000 in Cincinnati, OH
RELATED REPORTS & OPTIONS
Household Income | $100k+
Cincinnati
Compare Zip Codes
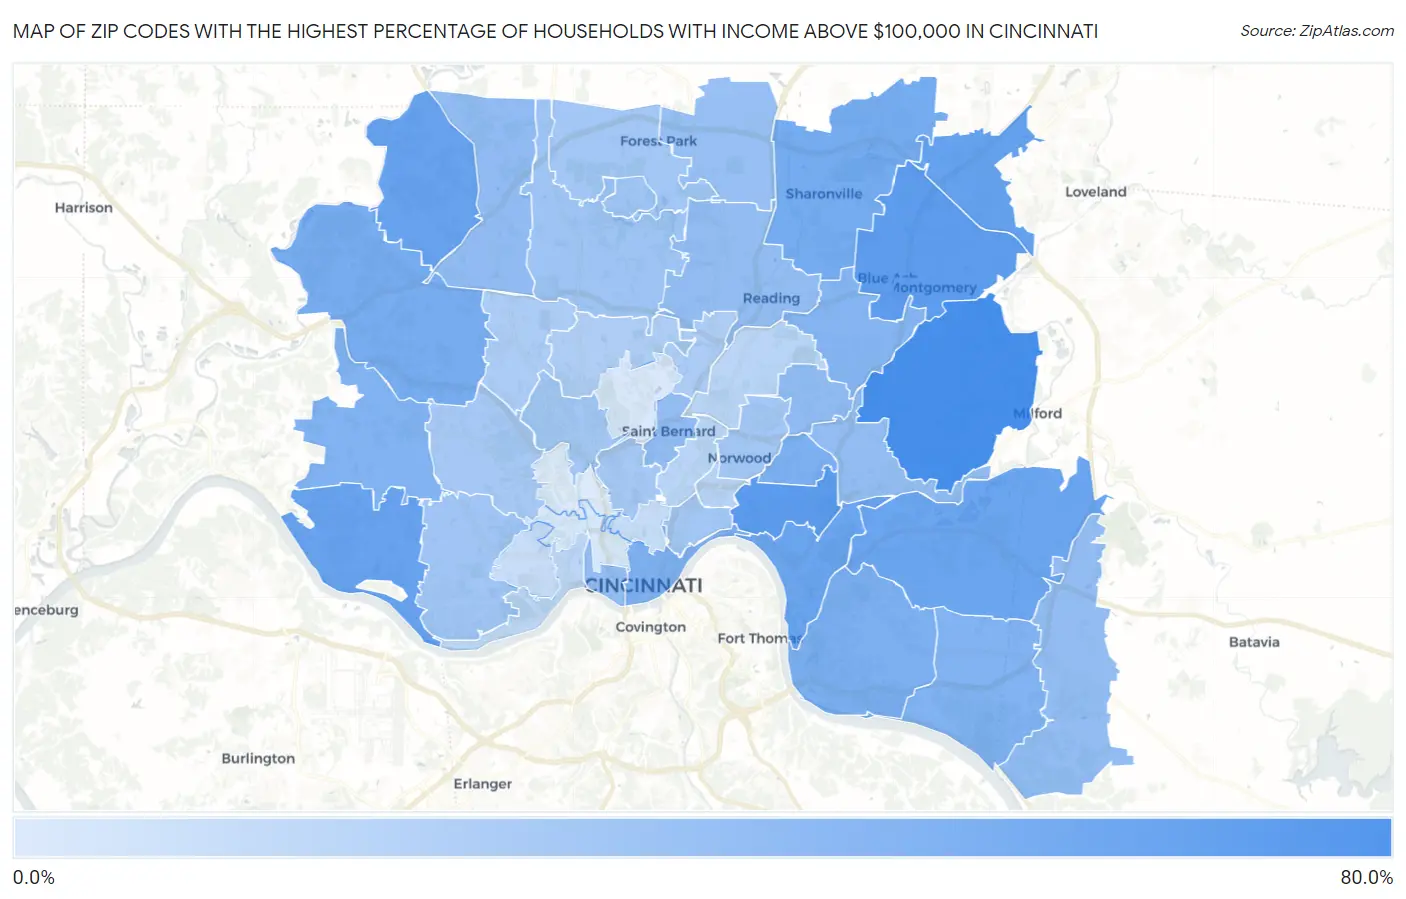
Map of Zip Codes with the Highest Percentage of Households with Income Above $100,000 in Cincinnati
3.5%
71.7%
Zip Codes with the Highest Percentage of Households with Income Above $100,000 in Cincinnati, OH
| Zip Code | Households with Income > $100k | vs State | vs National | |
| 1. | 45243 | 71.7% | 31.5%(+40.2)#17 | 37.3%(+34.4)#806 |
| 2. | 45208 | 59.9% | 31.5%(+28.4)#42 | 37.3%(+22.6)#2,388 |
| 3. | 45242 | 59.2% | 31.5%(+27.7)#45 | 37.3%(+21.9)#2,523 |
| 4. | 45249 | 55.2% | 31.5%(+23.7)#58 | 37.3%(+17.9)#3,400 |
| 5. | 45252 | 53.5% | 31.5%(+22.0)#71 | 37.3%(+16.2)#3,839 |
| 6. | 45233 | 53.4% | 31.5%(+21.9)#73 | 37.3%(+16.1)#3,859 |
| 7. | 45244 | 51.8% | 31.5%(+20.3)#86 | 37.3%(+14.5)#4,293 |
| 8. | 45226 | 51.0% | 31.5%(+19.5)#94 | 37.3%(+13.7)#4,547 |
| 9. | 45241 | 47.3% | 31.5%(+15.8)#129 | 37.3%(+10.00)#5,735 |
| 10. | 45247 | 45.3% | 31.5%(+13.8)#150 | 37.3%(+8.00)#6,500 |
| 11. | 45230 | 43.2% | 31.5%(+11.7)#182 | 37.3%(+5.90)#7,329 |
| 12. | 45209 | 43.2% | 31.5%(+11.7)#183 | 37.3%(+5.90)#7,338 |
| 13. | 45202 | 42.1% | 31.5%(+10.6)#204 | 37.3%(+4.80)#7,849 |
| 14. | 45248 | 41.4% | 31.5%(+9.90)#216 | 37.3%(+4.10)#8,159 |
| 15. | 45255 | 40.8% | 31.5%(+9.30)#228 | 37.3%(+3.50)#8,513 |
| 16. | 45236 | 39.0% | 31.5%(+7.50)#270 | 37.3%(+1.70)#9,420 |
| 17. | 45213 | 33.9% | 31.5%(+2.40)#390 | 37.3%(-3.40)#12,506 |
| 18. | 45251 | 33.4% | 31.5%(+1.90)#404 | 37.3%(-3.90)#12,823 |
| 19. | 45203 | 33.2% | 31.5%(+1.70)#411 | 37.3%(-4.10)#12,985 |
| 20. | 45215 | 33.0% | 31.5%(+1.50)#417 | 37.3%(-4.30)#13,103 |
| 21. | 45227 | 32.9% | 31.5%(+1.40)#424 | 37.3%(-4.40)#13,194 |
| 22. | 45217 | 32.7% | 31.5%(+1.20)#427 | 37.3%(-4.60)#13,341 |
| 23. | 45245 | 32.6% | 31.5%(+1.10)#430 | 37.3%(-4.70)#13,391 |
| 24. | 45246 | 31.1% | 31.5%(-0.400)#479 | 37.3%(-6.20)#14,564 |
| 25. | 45231 | 27.9% | 31.5%(-3.60)#588 | 37.3%(-9.40)#17,198 |
| 26. | 45218 | 27.7% | 31.5%(-3.80)#600 | 37.3%(-9.60)#17,403 |
| 27. | 45238 | 26.4% | 31.5%(-5.10)#641 | 37.3%(-10.9)#18,493 |
| 28. | 45240 | 26.2% | 31.5%(-5.30)#651 | 37.3%(-11.1)#18,701 |
| 29. | 45223 | 26.0% | 31.5%(-5.50)#662 | 37.3%(-11.3)#18,871 |
| 30. | 45212 | 25.8% | 31.5%(-5.70)#670 | 37.3%(-11.5)#19,050 |
| 31. | 45206 | 25.4% | 31.5%(-6.10)#685 | 37.3%(-11.9)#19,402 |
| 32. | 45211 | 24.7% | 31.5%(-6.80)#715 | 37.3%(-12.6)#20,001 |
| 33. | 45220 | 24.7% | 31.5%(-6.80)#718 | 37.3%(-12.6)#20,018 |
| 34. | 45239 | 22.2% | 31.5%(-9.30)#798 | 37.3%(-15.1)#22,216 |
| 35. | 45216 | 21.6% | 31.5%(-9.90)#819 | 37.3%(-15.7)#22,727 |
| 36. | 45224 | 20.7% | 31.5%(-10.8)#844 | 37.3%(-16.6)#23,474 |
| 37. | 45207 | 16.8% | 31.5%(-14.7)#963 | 37.3%(-20.5)#26,373 |
| 38. | 45229 | 16.7% | 31.5%(-14.8)#967 | 37.3%(-20.6)#26,440 |
| 39. | 45237 | 16.3% | 31.5%(-15.2)#974 | 37.3%(-21.0)#26,710 |
| 40. | 45204 | 15.0% | 31.5%(-16.5)#1,011 | 37.3%(-22.3)#27,542 |
| 41. | 45219 | 11.7% | 31.5%(-19.8)#1,068 | 37.3%(-25.6)#29,146 |
| 42. | 45205 | 11.0% | 31.5%(-20.5)#1,078 | 37.3%(-26.3)#29,449 |
| 43. | 45214 | 5.6% | 31.5%(-25.9)#1,142 | 37.3%(-31.7)#30,938 |
| 44. | 45232 | 4.4% | 31.5%(-27.1)#1,150 | 37.3%(-32.9)#31,155 |
| 45. | 45225 | 3.5% | 31.5%(-28.0)#1,154 | 37.3%(-33.8)#31,258 |
1
Common Questions
What are the Top 10 Zip Codes with the Highest Percentage of Households with Income Above $100,000 in Cincinnati, OH?
Top 10 Zip Codes with the Highest Percentage of Households with Income Above $100,000 in Cincinnati, OH are:
What zip code has the Highest Percentage of Households with Income Above $100,000 in Cincinnati, OH?
45243 has the Highest Percentage of Households with Income Above $100,000 in Cincinnati, OH with 71.7%.
What is the Percentage of Households with Income Above $100,000 in Cincinnati, OH?
Percentage of Households with Income Above $100,000 in Cincinnati is 24.3%.
What is the Percentage of Households with Income Above $100,000 in Ohio?
Percentage of Households with Income Above $100,000 in Ohio is 31.5%.
What is the Percentage of Households with Income Above $100,000 in the United States?
Percentage of Households with Income Above $100,000 in the United States is 37.3%.