Zip Codes with the Highest Percentage of Population Employed in Legal Services & Support in Sparks, NV
RELATED REPORTS & OPTIONS
Legal Services & Support
Sparks
Compare Zip Codes
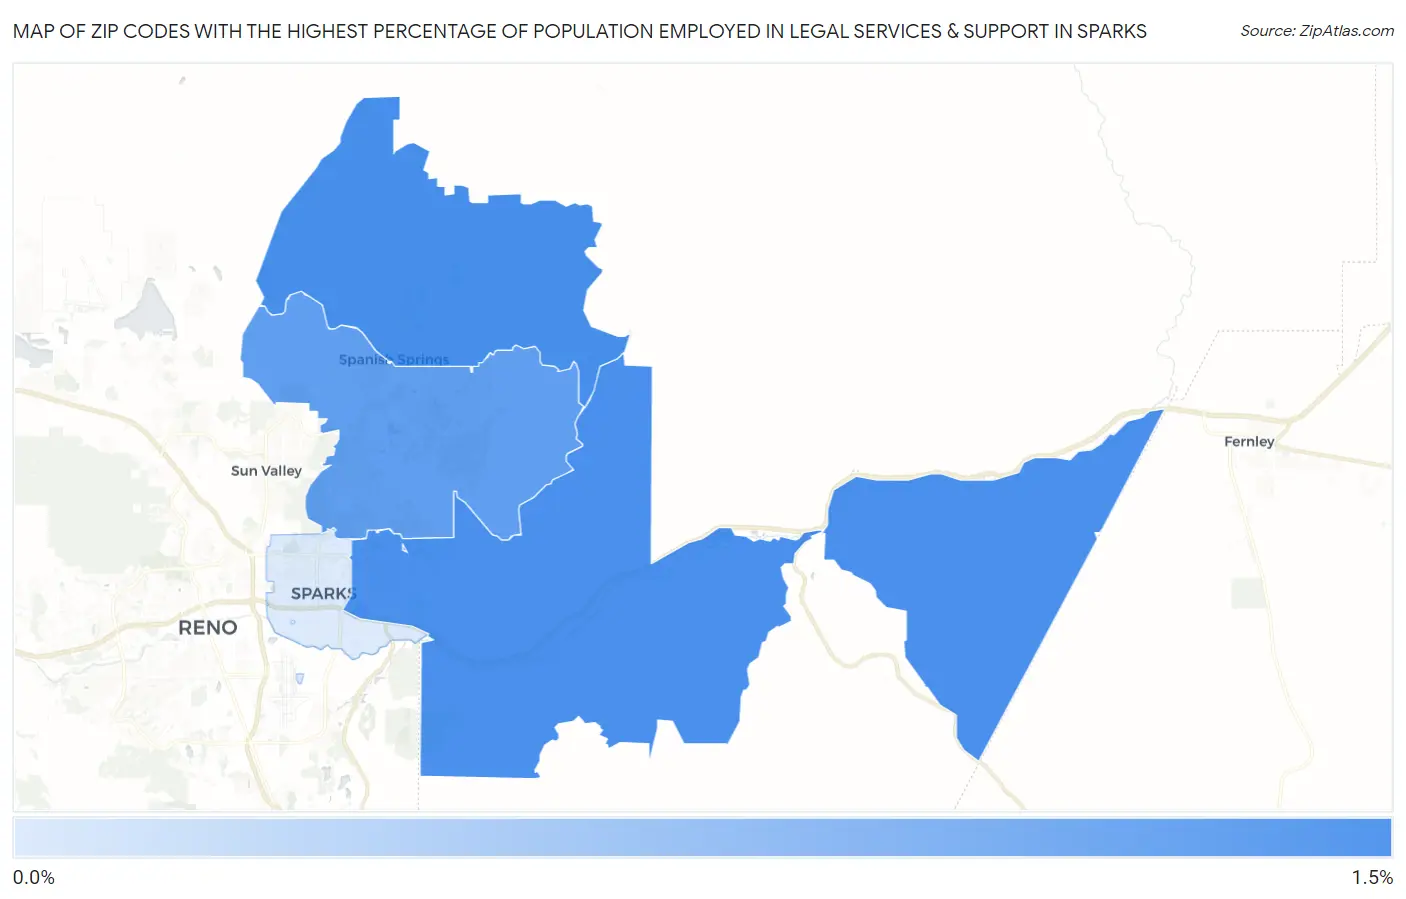
Map of Zip Codes with the Highest Percentage of Population Employed in Legal Services & Support in Sparks
0.34%
1.0%
Zip Codes with the Highest Percentage of Population Employed in Legal Services & Support in Sparks, NV
| Zip Code | % Employed | vs State | vs National | |
| 1. | 89441 | 1.0% | 0.99%(+0.041)#46 | 1.2%(-0.157)#7,637 |
| 2. | 89434 | 1.0% | 0.99%(+0.031)#49 | 1.2%(-0.166)#7,697 |
| 3. | 89436 | 0.91% | 0.99%(-0.076)#55 | 1.2%(-0.273)#8,507 |
| 4. | 89431 | 0.34% | 0.99%(-0.649)#94 | 1.2%(-0.847)#14,615 |
1
Common Questions
What are the Top 3 Zip Codes with the Highest Percentage of Population Employed in Legal Services & Support in Sparks, NV?
Top 3 Zip Codes with the Highest Percentage of Population Employed in Legal Services & Support in Sparks, NV are:
What zip code has the Highest Percentage of Population Employed in Legal Services & Support in Sparks, NV?
89441 has the Highest Percentage of Population Employed in Legal Services & Support in Sparks, NV with 1.0%.
What is the Percentage of Population Employed in Legal Services & Support in Sparks, NV?
Percentage of Population Employed in Legal Services & Support in Sparks is 0.74%.
What is the Percentage of Population Employed in Legal Services & Support in Nevada?
Percentage of Population Employed in Legal Services & Support in Nevada is 0.99%.
What is the Percentage of Population Employed in Legal Services & Support in the United States?
Percentage of Population Employed in Legal Services & Support in the United States is 1.2%.