Zip Codes with the Highest Percentage of Population Employed in Health Diagnosing & Treating in Sparks, NV
RELATED REPORTS & OPTIONS
Health Diagnosing & Treating
Sparks
Compare Zip Codes
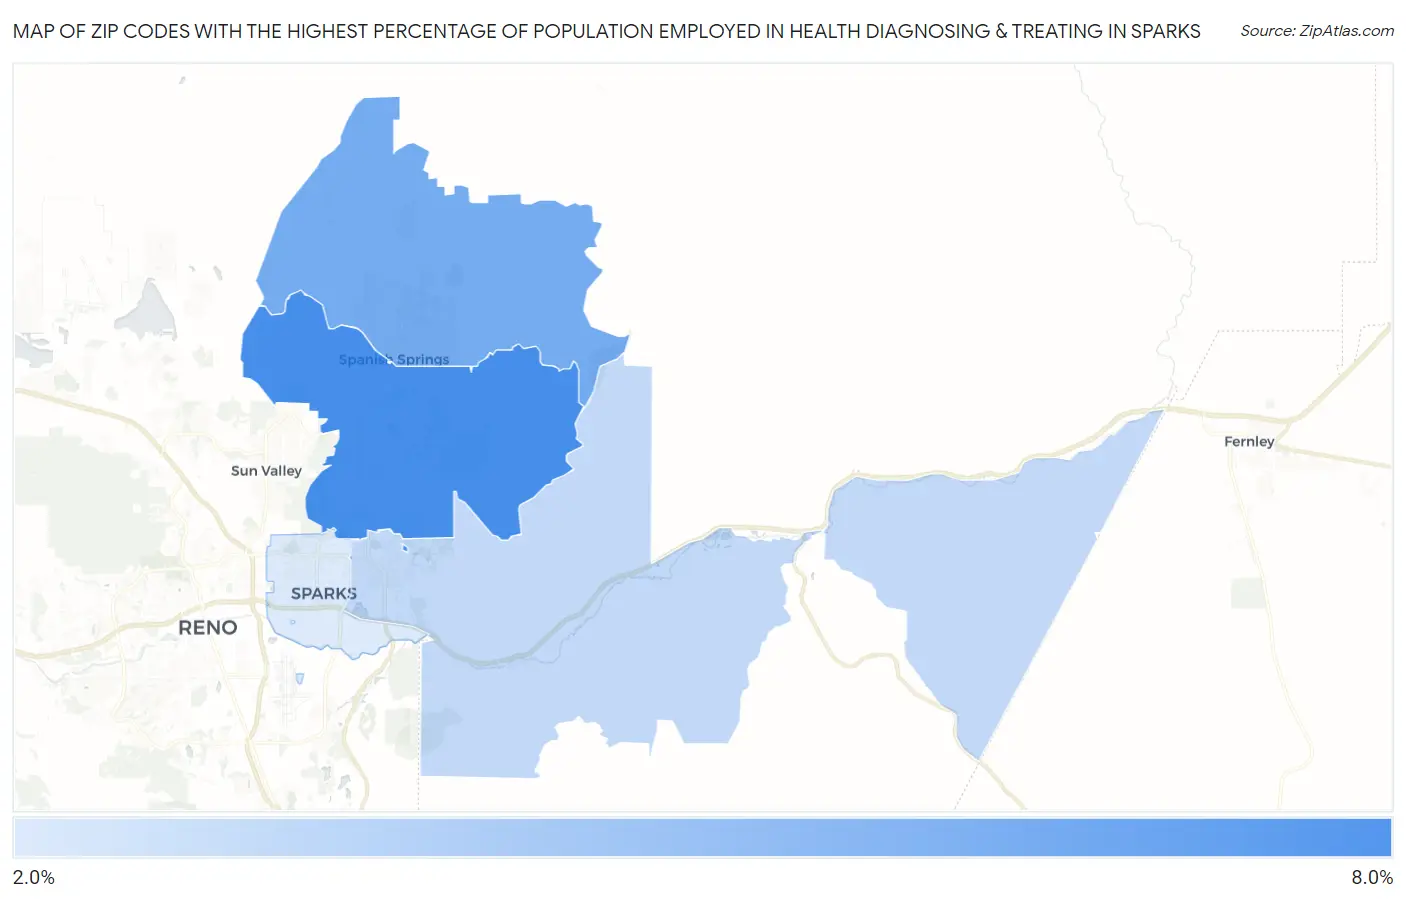
Map of Zip Codes with the Highest Percentage of Population Employed in Health Diagnosing & Treating in Sparks
2.2%
7.0%
Zip Codes with the Highest Percentage of Population Employed in Health Diagnosing & Treating in Sparks, NV
| Zip Code | % Employed | vs State | vs National | |
| 1. | 89436 | 7.0% | 4.9%(+2.13)#36 | 6.2%(+0.798)#10,221 |
| 2. | 89441 | 5.5% | 4.9%(+0.620)#48 | 6.2%(-0.713)#15,668 |
| 3. | 89434 | 3.1% | 4.9%(-1.80)#94 | 6.2%(-3.13)#24,022 |
| 4. | 89431 | 2.2% | 4.9%(-2.69)#110 | 6.2%(-4.02)#26,054 |
1
Common Questions
What are the Top 3 Zip Codes with the Highest Percentage of Population Employed in Health Diagnosing & Treating in Sparks, NV?
Top 3 Zip Codes with the Highest Percentage of Population Employed in Health Diagnosing & Treating in Sparks, NV are:
What zip code has the Highest Percentage of Population Employed in Health Diagnosing & Treating in Sparks, NV?
89436 has the Highest Percentage of Population Employed in Health Diagnosing & Treating in Sparks, NV with 7.0%.
What is the Percentage of Population Employed in Health Diagnosing & Treating in Sparks, NV?
Percentage of Population Employed in Health Diagnosing & Treating in Sparks is 4.3%.
What is the Percentage of Population Employed in Health Diagnosing & Treating in Nevada?
Percentage of Population Employed in Health Diagnosing & Treating in Nevada is 4.9%.
What is the Percentage of Population Employed in Health Diagnosing & Treating in the United States?
Percentage of Population Employed in Health Diagnosing & Treating in the United States is 6.2%.