Zip Codes with the Highest Percentage of Population with a Degree in Visual and Performing Arts in Sparks, NV
RELATED REPORTS & OPTIONS
Visual and Performing Arts
Sparks
Compare Zip Codes
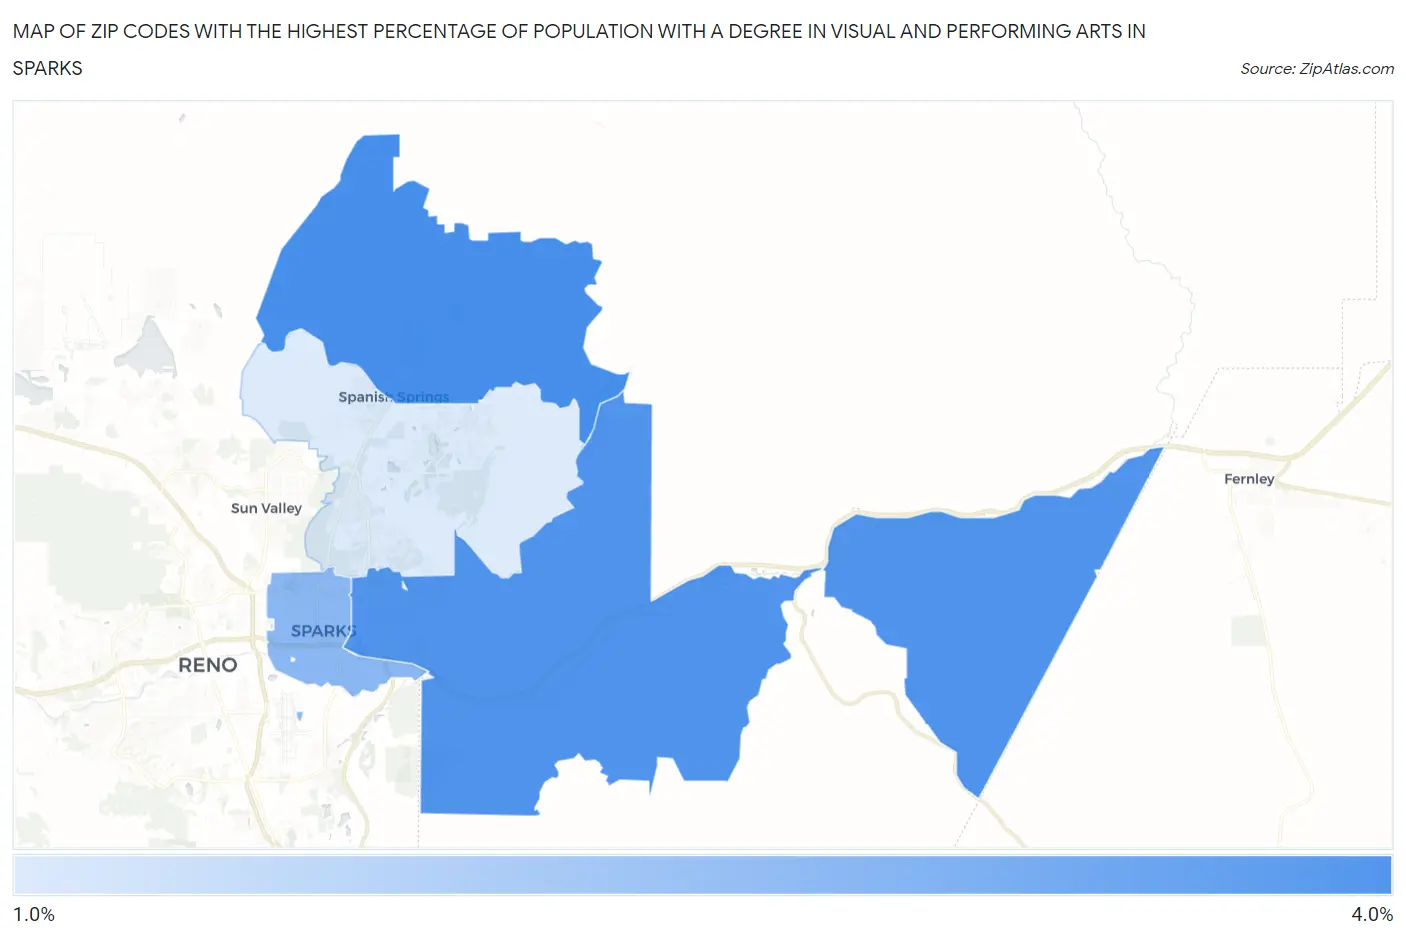
Map of Zip Codes with the Highest Percentage of Population with a Degree in Visual and Performing Arts in Sparks
1.6%
3.6%
Zip Codes with the Highest Percentage of Population with a Degree in Visual and Performing Arts in Sparks, NV
| Zip Code | % Graduates | vs State | vs National | |
| 1. | 89441 | 3.6% | 3.8%(-0.215)#57 | 4.3%(-0.674)#10,569 |
| 2. | 89434 | 3.4% | 3.8%(-0.354)#68 | 4.3%(-0.813)#11,118 |
| 3. | 89431 | 2.7% | 3.8%(-1.11)#81 | 4.3%(-1.57)#13,963 |
| 4. | 89436 | 1.6% | 3.8%(-2.21)#99 | 4.3%(-2.67)#17,894 |
1
Common Questions
What are the Top 3 Zip Codes with the Highest Percentage of Population with a Degree in Visual and Performing Arts in Sparks, NV?
Top 3 Zip Codes with the Highest Percentage of Population with a Degree in Visual and Performing Arts in Sparks, NV are:
What zip code has the Highest Percentage of Population with a Degree in Visual and Performing Arts in Sparks, NV?
89441 has the Highest Percentage of Population with a Degree in Visual and Performing Arts in Sparks, NV with 3.6%.
What is the Percentage of Population with a Degree in Visual and Performing Arts in Sparks, NV?
Percentage of Population with a Degree in Visual and Performing Arts in Sparks is 2.2%.
What is the Percentage of Population with a Degree in Visual and Performing Arts in Nevada?
Percentage of Population with a Degree in Visual and Performing Arts in Nevada is 3.8%.
What is the Percentage of Population with a Degree in Visual and Performing Arts in the United States?
Percentage of Population with a Degree in Visual and Performing Arts in the United States is 4.3%.