Zip Codes with the Highest Percentage of Population Employed in Architecture & Engineering in Sparks, NV
RELATED REPORTS & OPTIONS
Architecture & Engineering
Sparks
Compare Zip Codes
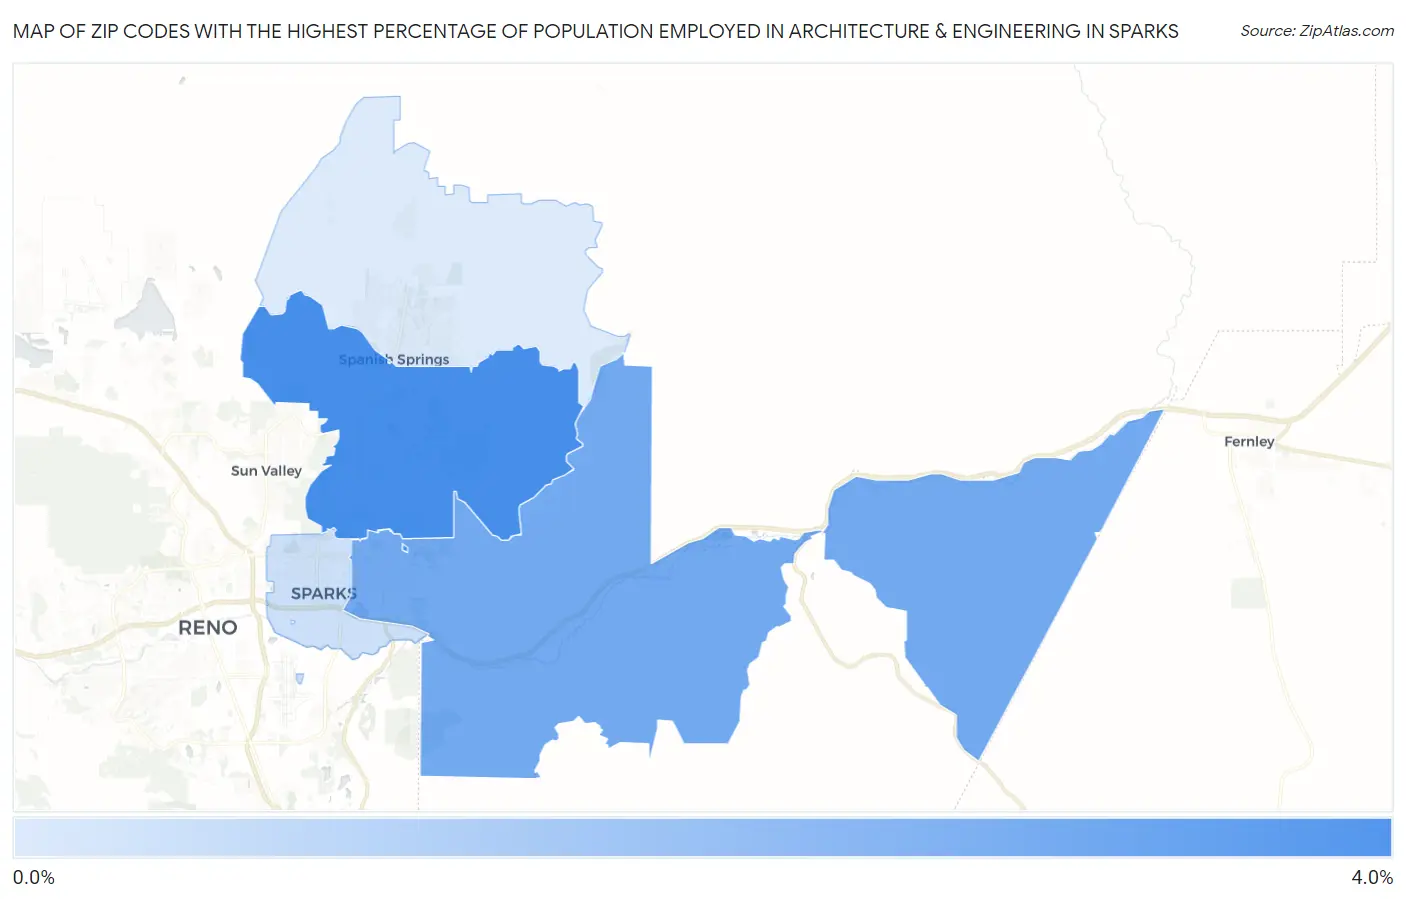
Map of Zip Codes with the Highest Percentage of Population Employed in Architecture & Engineering in Sparks
0.91%
3.7%
Zip Codes with the Highest Percentage of Population Employed in Architecture & Engineering in Sparks, NV
| Zip Code | % Employed | vs State | vs National | |
| 1. | 89436 | 3.7% | 1.5%(+2.25)#14 | 2.1%(+1.58)#3,238 |
| 2. | 89434 | 2.9% | 1.5%(+1.43)#22 | 2.1%(+0.764)#5,380 |
| 3. | 89431 | 1.2% | 1.5%(-0.293)#65 | 2.1%(-0.957)#15,147 |
| 4. | 89441 | 0.91% | 1.5%(-0.575)#76 | 2.1%(-1.24)#17,295 |
1
Common Questions
What are the Top 3 Zip Codes with the Highest Percentage of Population Employed in Architecture & Engineering in Sparks, NV?
Top 3 Zip Codes with the Highest Percentage of Population Employed in Architecture & Engineering in Sparks, NV are:
What zip code has the Highest Percentage of Population Employed in Architecture & Engineering in Sparks, NV?
89436 has the Highest Percentage of Population Employed in Architecture & Engineering in Sparks, NV with 3.7%.
What is the Percentage of Population Employed in Architecture & Engineering in Sparks, NV?
Percentage of Population Employed in Architecture & Engineering in Sparks is 2.7%.
What is the Percentage of Population Employed in Architecture & Engineering in Nevada?
Percentage of Population Employed in Architecture & Engineering in Nevada is 1.5%.
What is the Percentage of Population Employed in Architecture & Engineering in the United States?
Percentage of Population Employed in Architecture & Engineering in the United States is 2.1%.