Zip Codes with the Highest Percentage of Population Employed in Life, Physical & Social Science in Sparks, NV
RELATED REPORTS & OPTIONS
Life, Physical & Social Science
Sparks
Compare Zip Codes
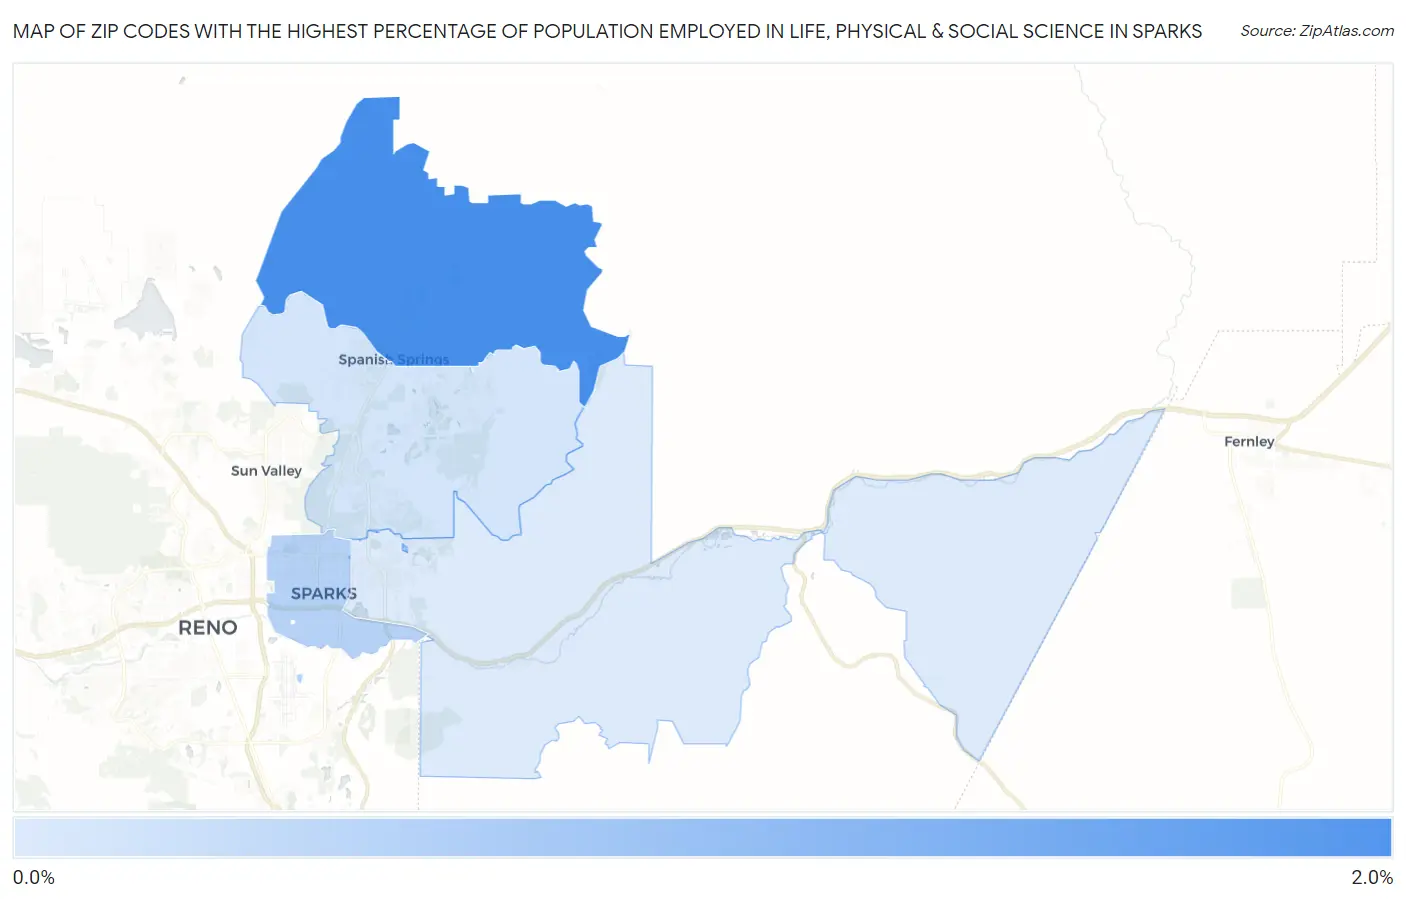
Map of Zip Codes with the Highest Percentage of Population Employed in Life, Physical & Social Science in Sparks
0.47%
1.7%
Zip Codes with the Highest Percentage of Population Employed in Life, Physical & Social Science in Sparks, NV
| Zip Code | % Employed | vs State | vs National | |
| 1. | 89441 | 1.7% | 0.68%(+1.04)#23 | 1.1%(+0.626)#4,648 |
| 2. | 89431 | 0.79% | 0.68%(+0.113)#43 | 1.1%(-0.300)#11,085 |
| 3. | 89436 | 0.55% | 0.68%(-0.128)#59 | 1.1%(-0.540)#13,900 |
| 4. | 89434 | 0.47% | 0.68%(-0.207)#66 | 1.1%(-0.619)#14,876 |
1
Common Questions
What are the Top 3 Zip Codes with the Highest Percentage of Population Employed in Life, Physical & Social Science in Sparks, NV?
Top 3 Zip Codes with the Highest Percentage of Population Employed in Life, Physical & Social Science in Sparks, NV are:
What zip code has the Highest Percentage of Population Employed in Life, Physical & Social Science in Sparks, NV?
89441 has the Highest Percentage of Population Employed in Life, Physical & Social Science in Sparks, NV with 1.7%.
What is the Percentage of Population Employed in Life, Physical & Social Science in Sparks, NV?
Percentage of Population Employed in Life, Physical & Social Science in Sparks is 0.60%.
What is the Percentage of Population Employed in Life, Physical & Social Science in Nevada?
Percentage of Population Employed in Life, Physical & Social Science in Nevada is 0.68%.
What is the Percentage of Population Employed in Life, Physical & Social Science in the United States?
Percentage of Population Employed in Life, Physical & Social Science in the United States is 1.1%.