Zip Codes with the Highest Percentage of Population Employed in Administrative & Support Services in Sparks, NV
RELATED REPORTS & OPTIONS
Administrative & Support Services
Sparks
Compare Zip Codes
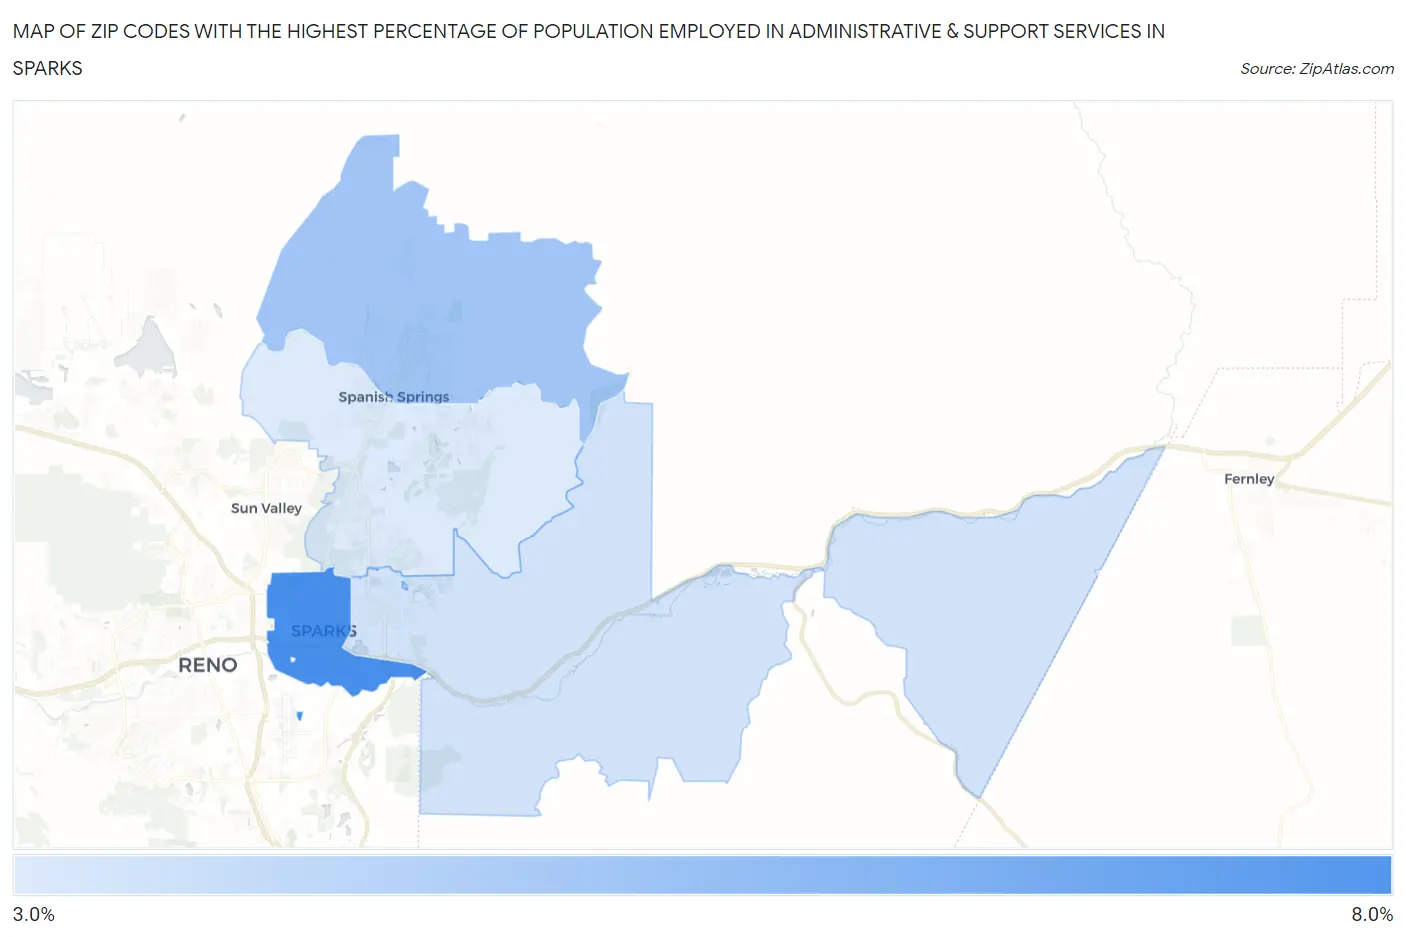
Map of Zip Codes with the Highest Percentage of Population Employed in Administrative & Support Services in Sparks
3.7%
6.9%
Zip Codes with the Highest Percentage of Population Employed in Administrative & Support Services in Sparks, NV
| Zip Code | % Employed | vs State | vs National | |
| 1. | 89431 | 6.9% | 5.5%(+1.39)#31 | 4.1%(+2.76)#3,332 |
| 2. | 89441 | 5.0% | 5.5%(-0.542)#61 | 4.1%(+0.825)#7,180 |
| 3. | 89434 | 3.9% | 5.5%(-1.60)#84 | 4.1%(-0.233)#11,025 |
| 4. | 89436 | 3.7% | 5.5%(-1.83)#89 | 4.1%(-0.465)#12,053 |
1
Common Questions
What are the Top 3 Zip Codes with the Highest Percentage of Population Employed in Administrative & Support Services in Sparks, NV?
Top 3 Zip Codes with the Highest Percentage of Population Employed in Administrative & Support Services in Sparks, NV are:
What zip code has the Highest Percentage of Population Employed in Administrative & Support Services in Sparks, NV?
89431 has the Highest Percentage of Population Employed in Administrative & Support Services in Sparks, NV with 6.9%.
What is the Percentage of Population Employed in Administrative & Support Services in Sparks, NV?
Percentage of Population Employed in Administrative & Support Services in Sparks is 4.9%.
What is the Percentage of Population Employed in Administrative & Support Services in Nevada?
Percentage of Population Employed in Administrative & Support Services in Nevada is 5.5%.
What is the Percentage of Population Employed in Administrative & Support Services in the United States?
Percentage of Population Employed in Administrative & Support Services in the United States is 4.1%.