Zip Codes with the Highest Percentage of Population Employed in Installation, Maintenance & Repair in Sparks, NV
RELATED REPORTS & OPTIONS
Installation, Maintenance & Repair
Sparks
Compare Zip Codes
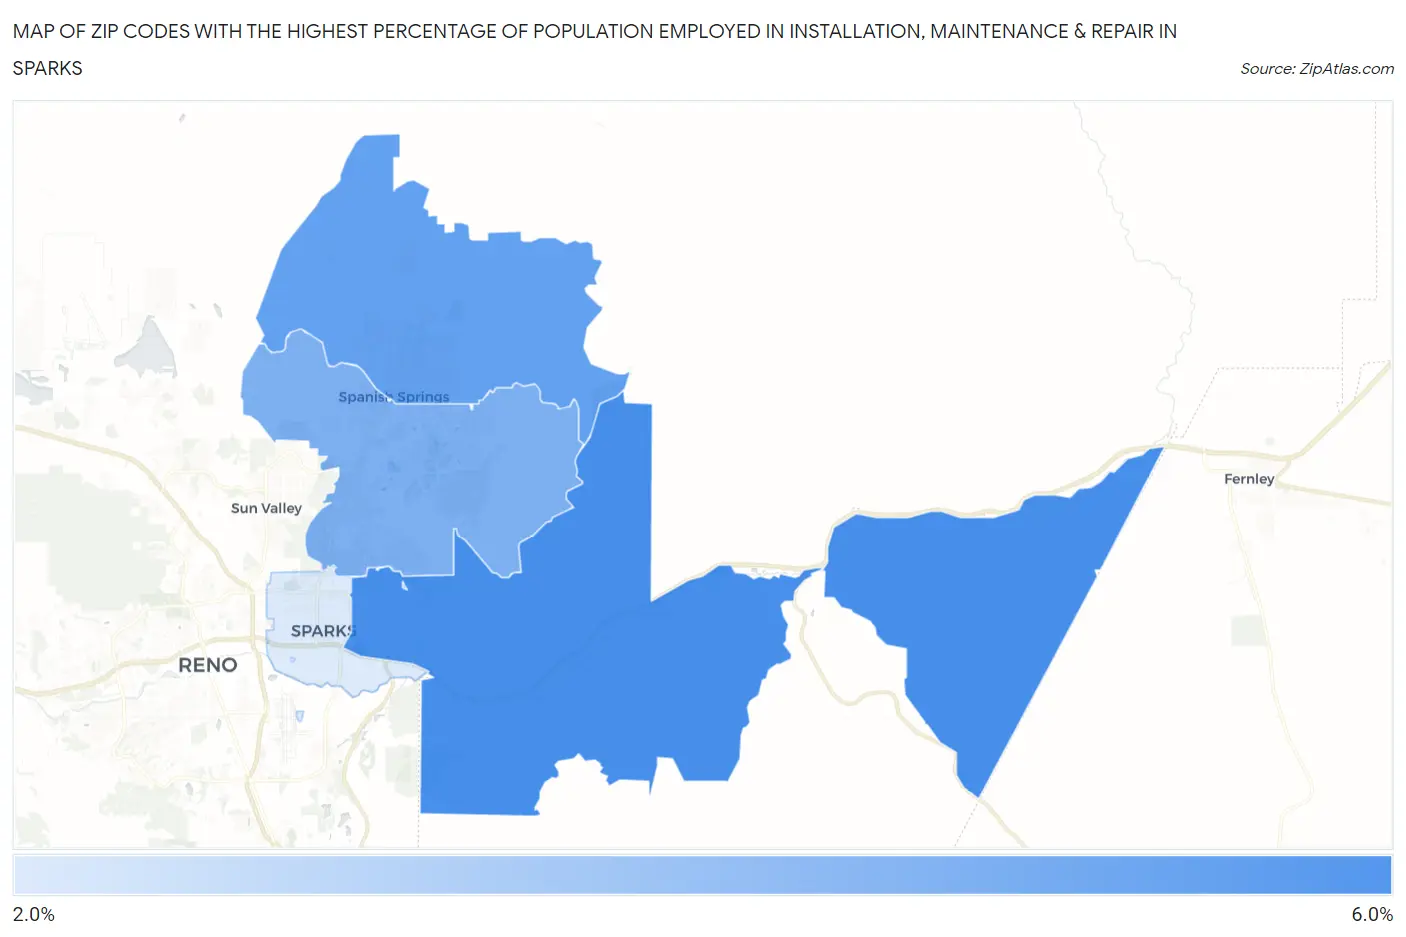
Map of Zip Codes with the Highest Percentage of Population Employed in Installation, Maintenance & Repair in Sparks
2.6%
5.3%
Zip Codes with the Highest Percentage of Population Employed in Installation, Maintenance & Repair in Sparks, NV
| Zip Code | % Employed | vs State | vs National | |
| 1. | 89434 | 5.3% | 3.2%(+2.09)#30 | 3.1%(+2.24)#7,794 |
| 2. | 89441 | 4.8% | 3.2%(+1.57)#39 | 3.1%(+1.72)#9,397 |
| 3. | 89436 | 4.3% | 3.2%(+1.10)#45 | 3.1%(+1.25)#11,089 |
| 4. | 89431 | 2.6% | 3.2%(-0.641)#86 | 3.1%(-0.493)#19,209 |
1
Common Questions
What are the Top 3 Zip Codes with the Highest Percentage of Population Employed in Installation, Maintenance & Repair in Sparks, NV?
Top 3 Zip Codes with the Highest Percentage of Population Employed in Installation, Maintenance & Repair in Sparks, NV are:
What zip code has the Highest Percentage of Population Employed in Installation, Maintenance & Repair in Sparks, NV?
89434 has the Highest Percentage of Population Employed in Installation, Maintenance & Repair in Sparks, NV with 5.3%.
What is the Percentage of Population Employed in Installation, Maintenance & Repair in Sparks, NV?
Percentage of Population Employed in Installation, Maintenance & Repair in Sparks is 3.8%.
What is the Percentage of Population Employed in Installation, Maintenance & Repair in Nevada?
Percentage of Population Employed in Installation, Maintenance & Repair in Nevada is 3.2%.
What is the Percentage of Population Employed in Installation, Maintenance & Repair in the United States?
Percentage of Population Employed in Installation, Maintenance & Repair in the United States is 3.1%.