Zip Codes with the Highest Percentage of Not-for-profit Organizations in Florissant, MO
RELATED REPORTS & OPTIONS
Not-for-profit Organizations
Florissant
Compare Zip Codes
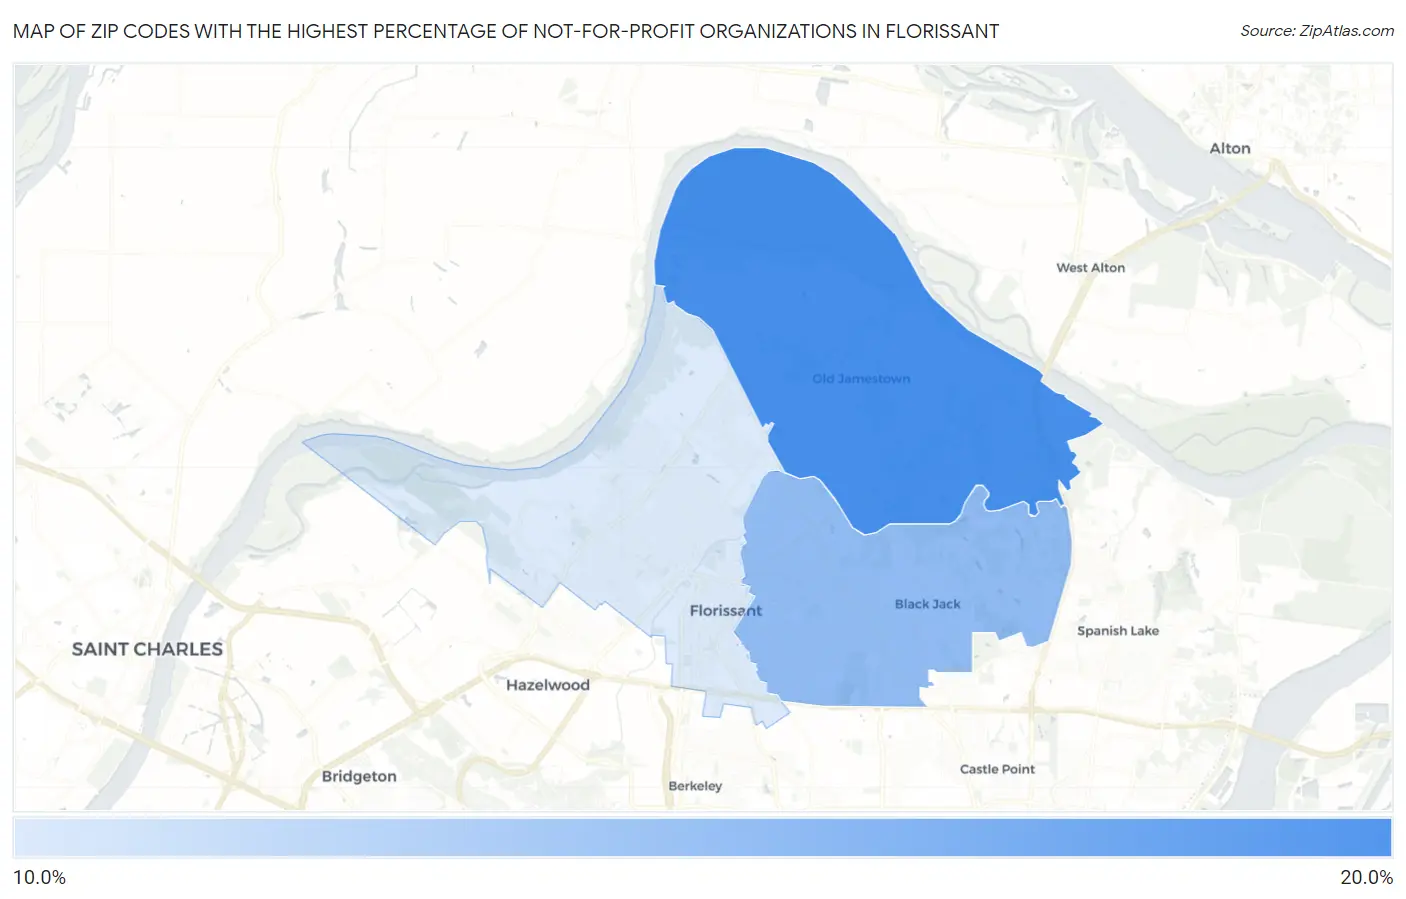
Map of Zip Codes with the Highest Percentage of Not-for-profit Organizations in Florissant
10.9%
16.7%
Zip Codes with the Highest Percentage of Not-for-profit Organizations in Florissant, MO
| Zip Code | % Employed in Not-for-profit | vs State | vs National | |
| 1. | 63034 | 16.7% | 10.2%(+6.52)#81 | 8.4%(+8.26)#2,139 |
| 2. | 63033 | 13.8% | 10.2%(+3.63)#146 | 8.4%(+5.37)#3,748 |
| 3. | 63031 | 10.9% | 10.2%(+0.735)#255 | 8.4%(+2.47)#7,194 |
1
Common Questions
What are the Top Zip Codes with the Highest Percentage of Not-for-profit Organizations in Florissant, MO?
Top Zip Codes with the Highest Percentage of Not-for-profit Organizations in Florissant, MO are:
What zip code has the Highest Percentage of Not-for-profit Organizations in Florissant, MO?
63034 has the Highest Percentage of Not-for-profit Organizations in Florissant, MO with 16.7%.
What is the Percentage of Not-for-profit Organizations in Florissant, MO?
Percentage of Not-for-profit Organizations in Florissant is 9.9%.
What is the Percentage of Not-for-profit Organizations in Missouri?
Percentage of Not-for-profit Organizations in Missouri is 10.2%.
What is the Percentage of Not-for-profit Organizations in the United States?
Percentage of Not-for-profit Organizations in the United States is 8.4%.