Zip Codes with the Highest Percentage of Population Employed in Community & Social Service in Florissant, MO
RELATED REPORTS & OPTIONS
Community & Social Service
Florissant
Compare Zip Codes
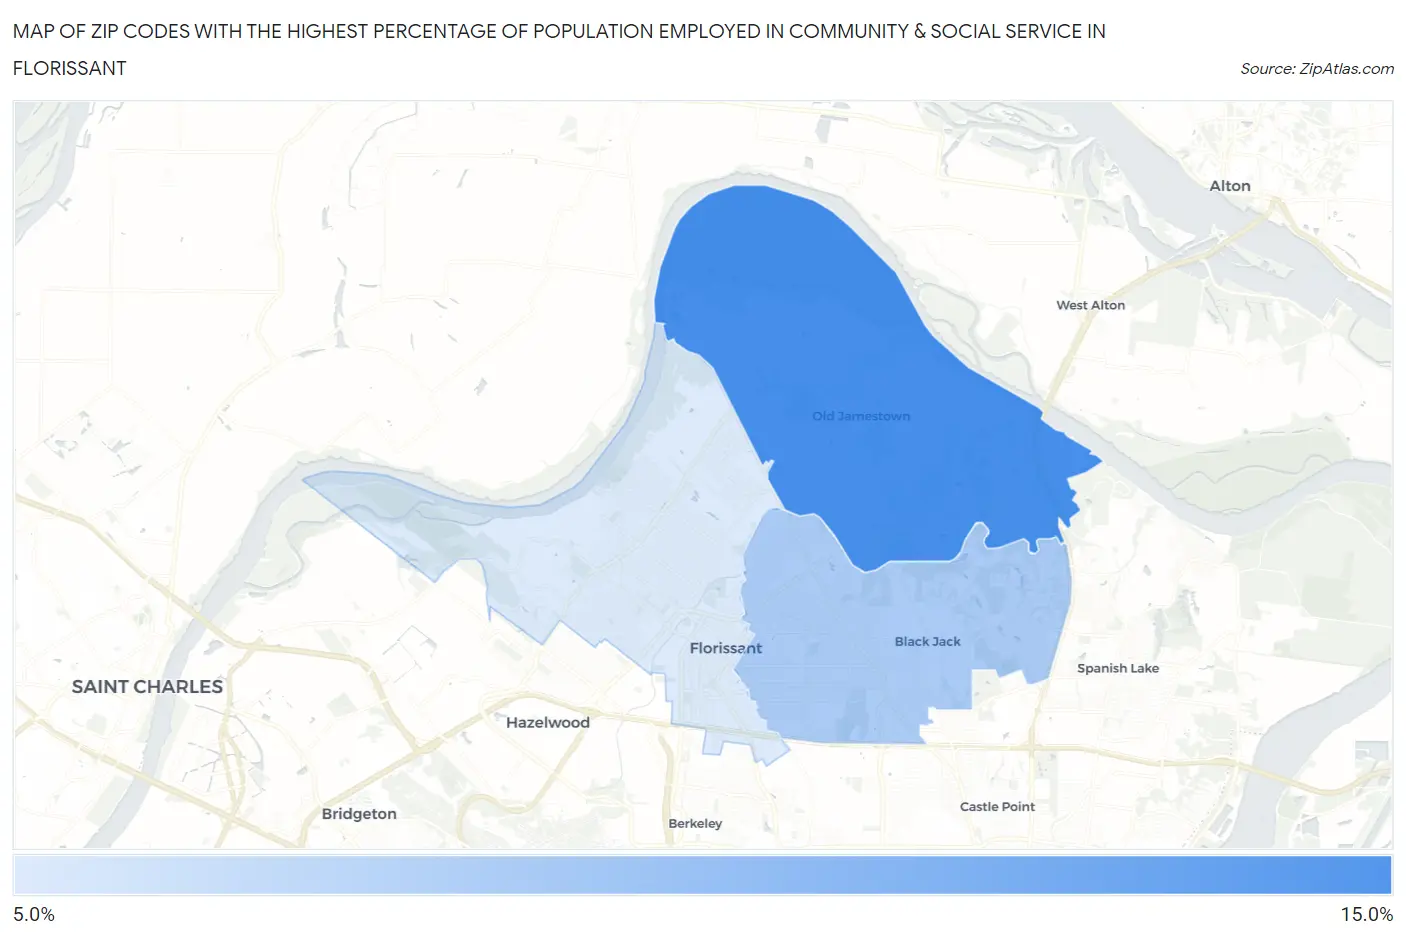
Map of Zip Codes with the Highest Percentage of Population Employed in Community & Social Service in Florissant
8.6%
12.7%
Zip Codes with the Highest Percentage of Population Employed in Community & Social Service in Florissant, MO
| Zip Code | % Employed | vs State | vs National | |
| 1. | 63034 | 12.7% | 10.6%(+2.18)#185 | 11.2%(+1.54)#7,982 |
| 2. | 63033 | 10.0% | 10.6%(-0.584)#353 | 11.2%(-1.23)#14,174 |
| 3. | 63031 | 8.6% | 10.6%(-1.96)#454 | 11.2%(-2.61)#17,870 |
1
Common Questions
What are the Top Zip Codes with the Highest Percentage of Population Employed in Community & Social Service in Florissant, MO?
Top Zip Codes with the Highest Percentage of Population Employed in Community & Social Service in Florissant, MO are:
What zip code has the Highest Percentage of Population Employed in Community & Social Service in Florissant, MO?
63034 has the Highest Percentage of Population Employed in Community & Social Service in Florissant, MO with 12.7%.
What is the Percentage of Population Employed in Community & Social Service in Florissant, MO?
Percentage of Population Employed in Community & Social Service in Florissant is 7.3%.
What is the Percentage of Population Employed in Community & Social Service in Missouri?
Percentage of Population Employed in Community & Social Service in Missouri is 10.6%.
What is the Percentage of Population Employed in Community & Social Service in the United States?
Percentage of Population Employed in Community & Social Service in the United States is 11.2%.