Zip Codes with the Highest Percentage of Population Employed in Installation, Maintenance & Repair in Florissant, MO
RELATED REPORTS & OPTIONS
Installation, Maintenance & Repair
Florissant
Compare Zip Codes
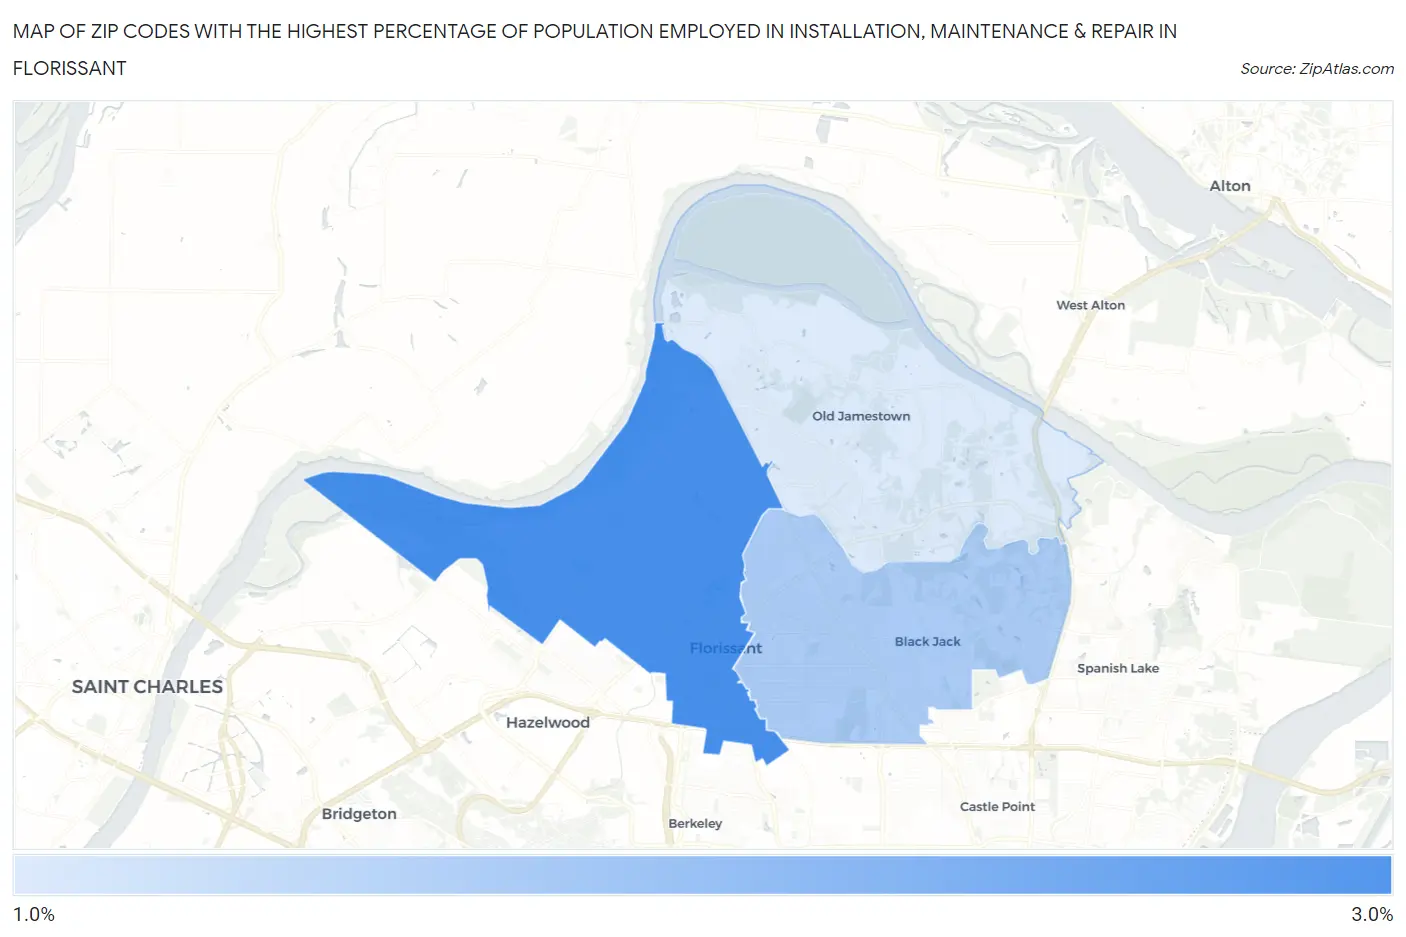
Map of Zip Codes with the Highest Percentage of Population Employed in Installation, Maintenance & Repair in Florissant
1.1%
2.7%
Zip Codes with the Highest Percentage of Population Employed in Installation, Maintenance & Repair in Florissant, MO
| Zip Code | % Employed | vs State | vs National | |
| 1. | 63031 | 2.7% | 3.2%(-0.554)#608 | 3.1%(-0.417)#18,816 |
| 2. | 63033 | 1.6% | 3.2%(-1.58)#760 | 3.1%(-1.45)#23,686 |
| 3. | 63034 | 1.1% | 3.2%(-2.12)#817 | 3.1%(-1.99)#25,665 |
1
Common Questions
What are the Top Zip Codes with the Highest Percentage of Population Employed in Installation, Maintenance & Repair in Florissant, MO?
Top Zip Codes with the Highest Percentage of Population Employed in Installation, Maintenance & Repair in Florissant, MO are:
What zip code has the Highest Percentage of Population Employed in Installation, Maintenance & Repair in Florissant, MO?
63031 has the Highest Percentage of Population Employed in Installation, Maintenance & Repair in Florissant, MO with 2.7%.
What is the Percentage of Population Employed in Installation, Maintenance & Repair in Florissant, MO?
Percentage of Population Employed in Installation, Maintenance & Repair in Florissant is 3.1%.
What is the Percentage of Population Employed in Installation, Maintenance & Repair in Missouri?
Percentage of Population Employed in Installation, Maintenance & Repair in Missouri is 3.2%.
What is the Percentage of Population Employed in Installation, Maintenance & Repair in the United States?
Percentage of Population Employed in Installation, Maintenance & Repair in the United States is 3.1%.