Zip Codes with the Highest Percentage of Households with Income Above $100,000 in Florissant, MO
RELATED REPORTS & OPTIONS
Household Income | $100k+
Florissant
Compare Zip Codes
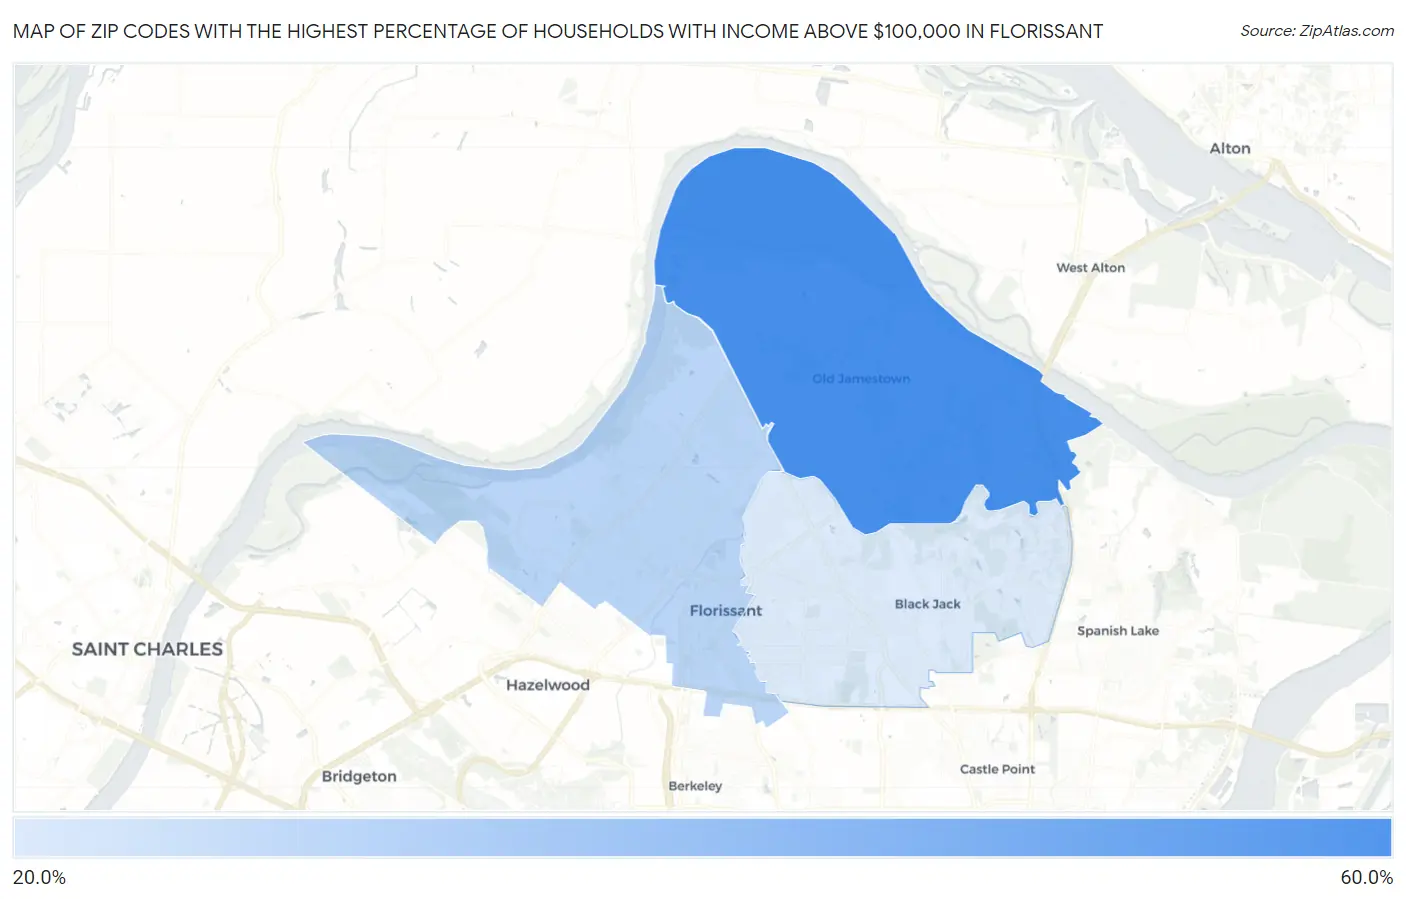
Map of Zip Codes with the Highest Percentage of Households with Income Above $100,000 in Florissant
24.9%
55.7%
Zip Codes with the Highest Percentage of Households with Income Above $100,000 in Florissant, MO
| Zip Code | Households with Income > $100k | vs State | vs National | |
| 1. | 63034 | 55.7% | 30.6%(+25.1)#40 | 37.3%(+18.4)#3,275 |
| 2. | 63031 | 31.2% | 30.6%(+0.600)#274 | 37.3%(-6.10)#14,451 |
| 3. | 63033 | 24.9% | 30.6%(-5.70)#434 | 37.3%(-12.4)#19,853 |
1
Common Questions
What are the Top Zip Codes with the Highest Percentage of Households with Income Above $100,000 in Florissant, MO?
Top Zip Codes with the Highest Percentage of Households with Income Above $100,000 in Florissant, MO are:
What zip code has the Highest Percentage of Households with Income Above $100,000 in Florissant, MO?
63034 has the Highest Percentage of Households with Income Above $100,000 in Florissant, MO with 55.7%.
What is the Percentage of Households with Income Above $100,000 in Florissant, MO?
Percentage of Households with Income Above $100,000 in Florissant is 25.2%.
What is the Percentage of Households with Income Above $100,000 in Missouri?
Percentage of Households with Income Above $100,000 in Missouri is 30.6%.
What is the Percentage of Households with Income Above $100,000 in the United States?
Percentage of Households with Income Above $100,000 in the United States is 37.3%.