Zip Codes with the Highest Percentage of Population Employed in Computer & Mathematics in Florissant, MO
RELATED REPORTS & OPTIONS
Computer & Mathematics
Florissant
Compare Zip Codes
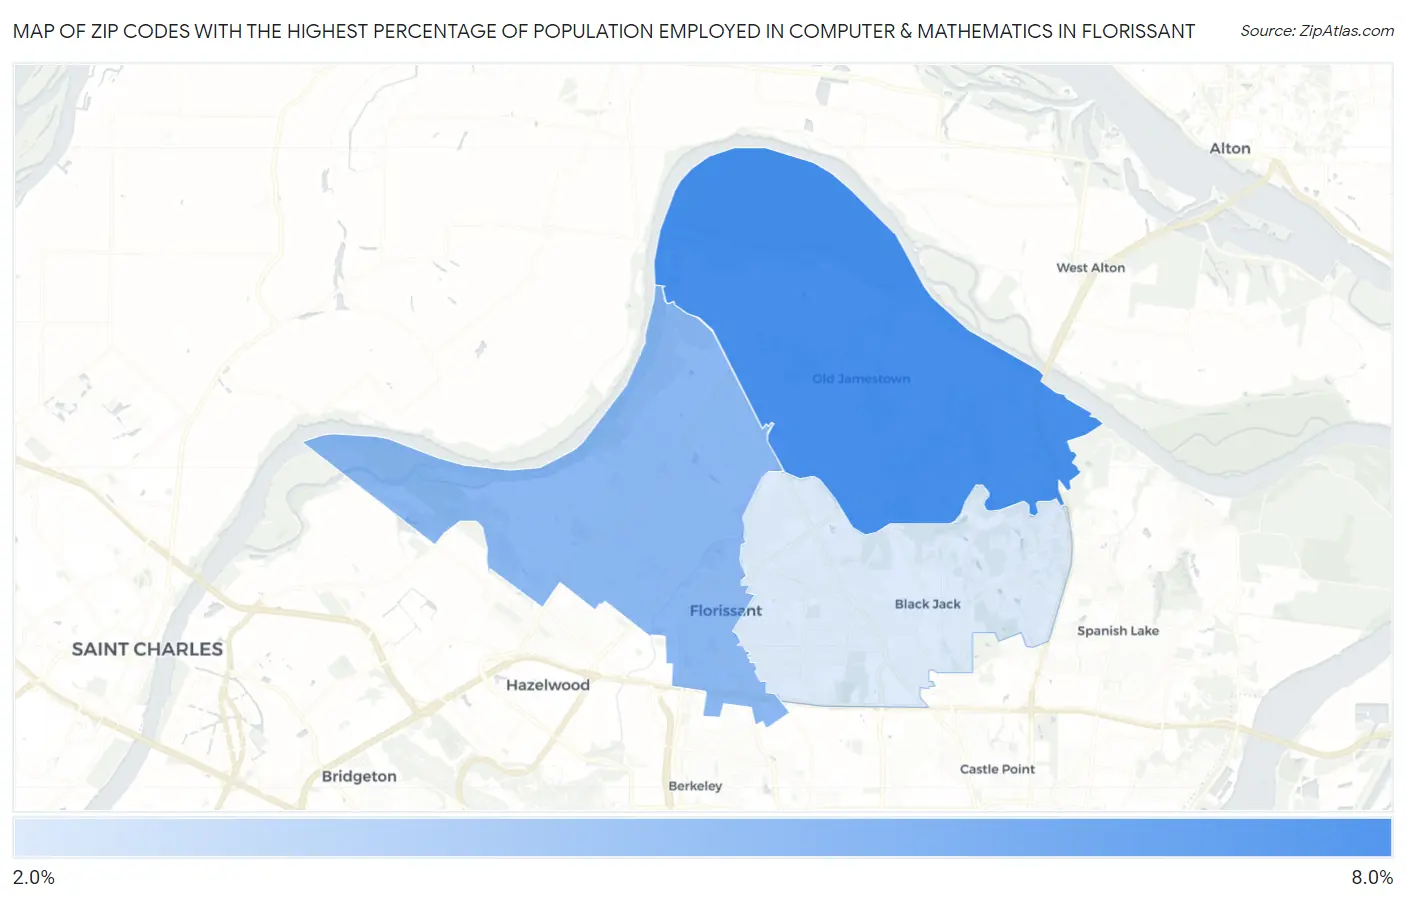
Map of Zip Codes with the Highest Percentage of Population Employed in Computer & Mathematics in Florissant
2.3%
6.3%
Zip Codes with the Highest Percentage of Population Employed in Computer & Mathematics in Florissant, MO
| Zip Code | % Employed | vs State | vs National | |
| 1. | 63034 | 6.3% | 3.2%(+3.12)#38 | 3.5%(+2.79)#2,069 |
| 2. | 63031 | 4.5% | 3.2%(+1.29)#92 | 3.5%(+0.958)#4,106 |
| 3. | 63033 | 2.3% | 3.2%(-0.914)#241 | 3.5%(-1.25)#10,559 |
1
Common Questions
What are the Top Zip Codes with the Highest Percentage of Population Employed in Computer & Mathematics in Florissant, MO?
Top Zip Codes with the Highest Percentage of Population Employed in Computer & Mathematics in Florissant, MO are:
What zip code has the Highest Percentage of Population Employed in Computer & Mathematics in Florissant, MO?
63034 has the Highest Percentage of Population Employed in Computer & Mathematics in Florissant, MO with 6.3%.
What is the Percentage of Population Employed in Computer & Mathematics in Florissant, MO?
Percentage of Population Employed in Computer & Mathematics in Florissant is 3.0%.
What is the Percentage of Population Employed in Computer & Mathematics in Missouri?
Percentage of Population Employed in Computer & Mathematics in Missouri is 3.2%.
What is the Percentage of Population Employed in Computer & Mathematics in the United States?
Percentage of Population Employed in Computer & Mathematics in the United States is 3.5%.