Zip Codes with the Highest Percentage of Population Employed in Office & Administration in Florissant, MO
RELATED REPORTS & OPTIONS
Office & Administration
Florissant
Compare Zip Codes
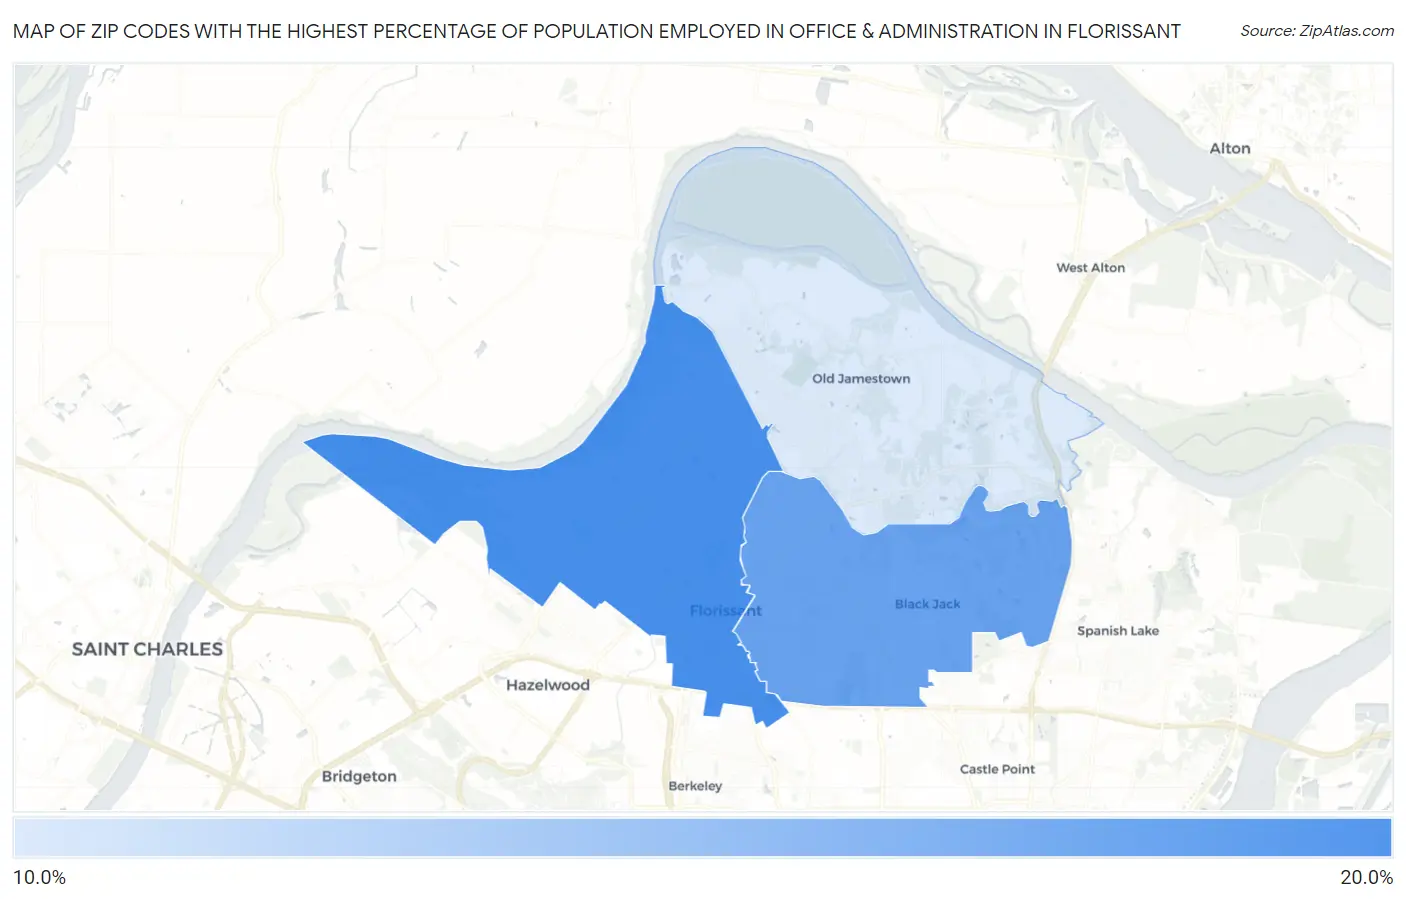
Map of Zip Codes with the Highest Percentage of Population Employed in Office & Administration in Florissant
12.1%
16.4%
Zip Codes with the Highest Percentage of Population Employed in Office & Administration in Florissant, MO
| Zip Code | % Employed | vs State | vs National | |
| 1. | 63031 | 16.4% | 11.3%(+5.05)#124 | 10.9%(+5.54)#3,250 |
| 2. | 63033 | 15.5% | 11.3%(+4.11)#165 | 10.9%(+4.60)#4,048 |
| 3. | 63034 | 12.1% | 11.3%(+0.702)#374 | 10.9%(+1.19)#10,569 |
1
Common Questions
What are the Top Zip Codes with the Highest Percentage of Population Employed in Office & Administration in Florissant, MO?
Top Zip Codes with the Highest Percentage of Population Employed in Office & Administration in Florissant, MO are:
What zip code has the Highest Percentage of Population Employed in Office & Administration in Florissant, MO?
63031 has the Highest Percentage of Population Employed in Office & Administration in Florissant, MO with 16.4%.
What is the Percentage of Population Employed in Office & Administration in Florissant, MO?
Percentage of Population Employed in Office & Administration in Florissant is 14.8%.
What is the Percentage of Population Employed in Office & Administration in Missouri?
Percentage of Population Employed in Office & Administration in Missouri is 11.3%.
What is the Percentage of Population Employed in Office & Administration in the United States?
Percentage of Population Employed in Office & Administration in the United States is 10.9%.