Zip Codes with the Highest Percentage of Population Employed in Office & Administration in Southfield, MI
RELATED REPORTS & OPTIONS
Office & Administration
Southfield
Compare Zip Codes
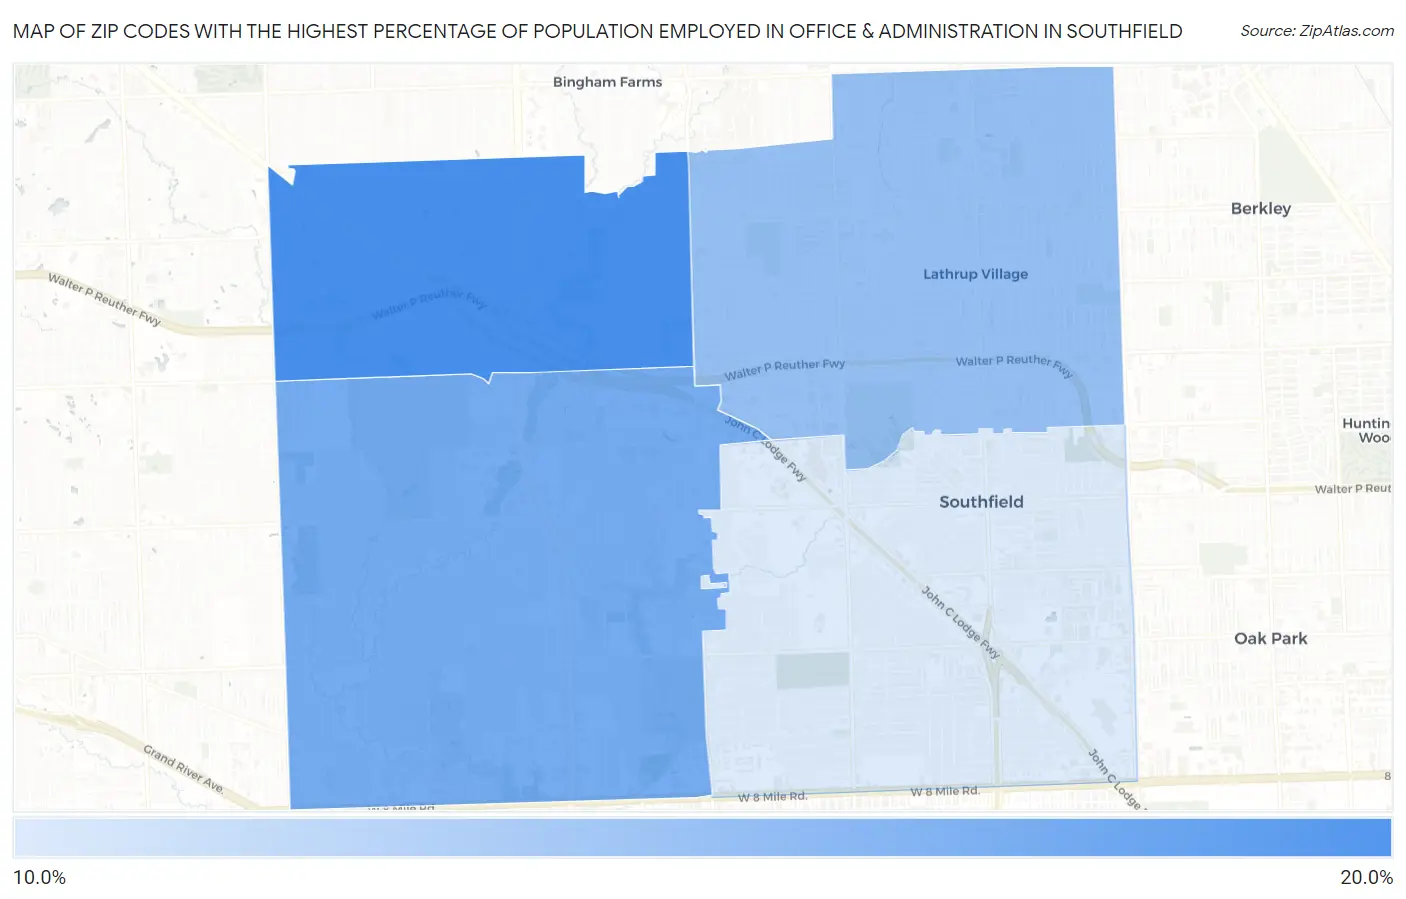
Map of Zip Codes with the Highest Percentage of Population Employed in Office & Administration in Southfield
10.5%
15.8%
Zip Codes with the Highest Percentage of Population Employed in Office & Administration in Southfield, MI
| Zip Code | % Employed | vs State | vs National | |
| 1. | 48034 | 15.8% | 10.8%(+4.95)#48 | 10.9%(+4.90)#3,771 |
| 2. | 48033 | 14.1% | 10.8%(+3.33)#114 | 10.9%(+3.28)#5,798 |
| 3. | 48076 | 13.0% | 10.8%(+2.15)#191 | 10.9%(+2.10)#8,170 |
| 4. | 48075 | 10.5% | 10.8%(-0.315)#480 | 10.9%(-0.364)#15,511 |
1
Common Questions
What are the Top 3 Zip Codes with the Highest Percentage of Population Employed in Office & Administration in Southfield, MI?
Top 3 Zip Codes with the Highest Percentage of Population Employed in Office & Administration in Southfield, MI are:
What zip code has the Highest Percentage of Population Employed in Office & Administration in Southfield, MI?
48034 has the Highest Percentage of Population Employed in Office & Administration in Southfield, MI with 15.8%.
What is the Percentage of Population Employed in Office & Administration in Southfield, MI?
Percentage of Population Employed in Office & Administration in Southfield is 13.2%.
What is the Percentage of Population Employed in Office & Administration in Michigan?
Percentage of Population Employed in Office & Administration in Michigan is 10.8%.
What is the Percentage of Population Employed in Office & Administration in the United States?
Percentage of Population Employed in Office & Administration in the United States is 10.9%.