Zip Codes with the Highest Percentage of Population Employed in Accommodation & Food Services in Southfield, MI
RELATED REPORTS & OPTIONS
Accommodation & Food Services
Southfield
Compare Zip Codes
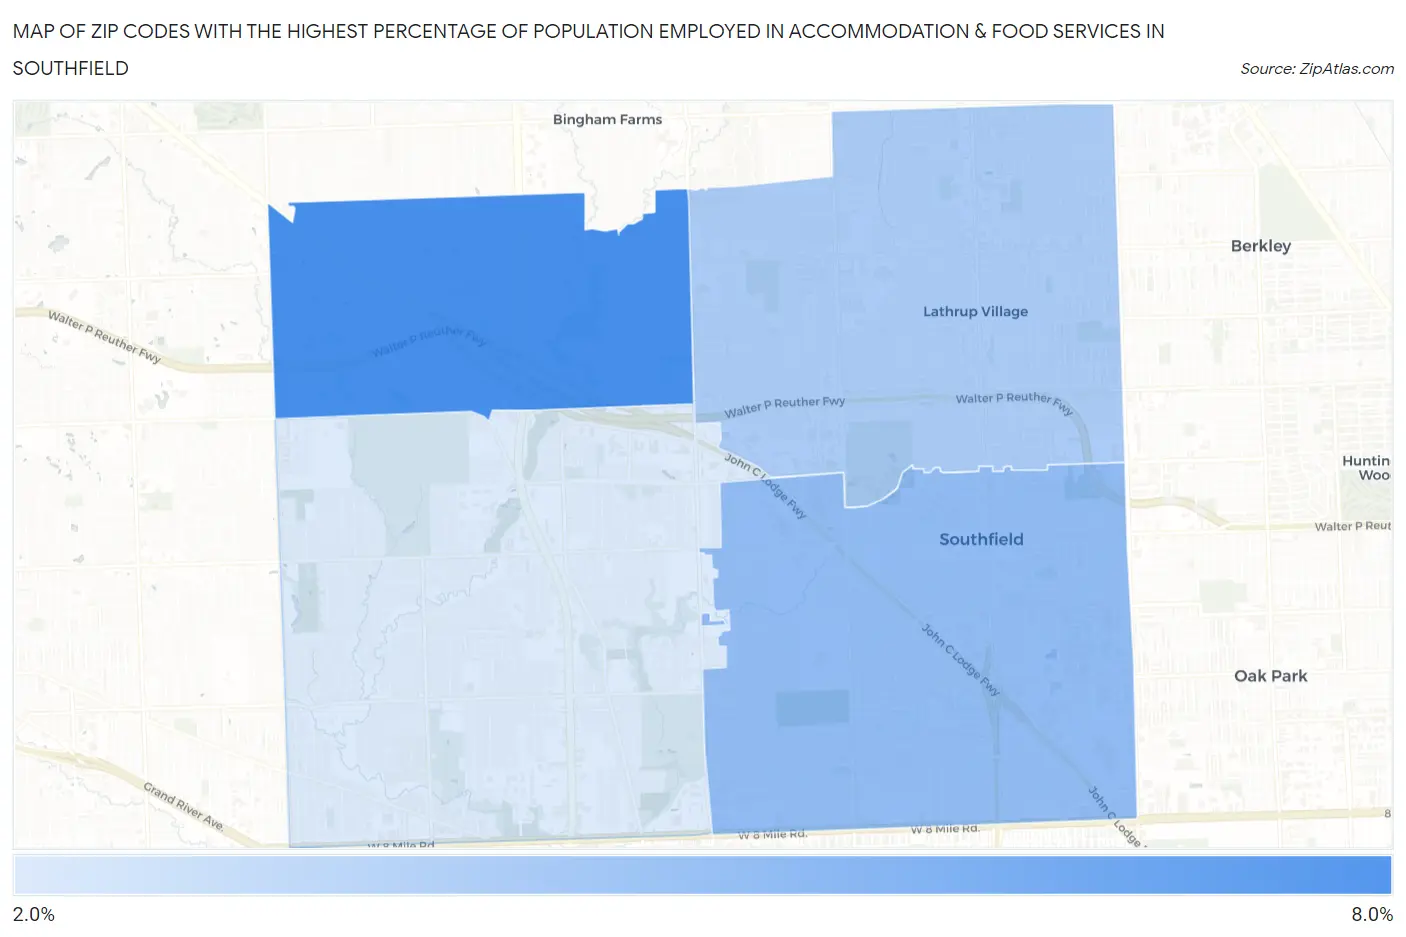
Map of Zip Codes with the Highest Percentage of Population Employed in Accommodation & Food Services in Southfield
2.5%
7.5%
Zip Codes with the Highest Percentage of Population Employed in Accommodation & Food Services in Southfield, MI
| Zip Code | % Employed | vs State | vs National | |
| 1. | 48034 | 7.5% | 7.1%(+0.374)#332 | 6.9%(+0.576)#9,088 |
| 2. | 48075 | 4.9% | 7.1%(-2.15)#673 | 6.9%(-1.94)#17,026 |
| 3. | 48076 | 4.1% | 7.1%(-2.97)#756 | 6.9%(-2.76)#19,762 |
| 4. | 48033 | 2.5% | 7.1%(-4.63)#879 | 6.9%(-4.42)#24,587 |
1
Common Questions
What are the Top 3 Zip Codes with the Highest Percentage of Population Employed in Accommodation & Food Services in Southfield, MI?
Top 3 Zip Codes with the Highest Percentage of Population Employed in Accommodation & Food Services in Southfield, MI are:
What zip code has the Highest Percentage of Population Employed in Accommodation & Food Services in Southfield, MI?
48034 has the Highest Percentage of Population Employed in Accommodation & Food Services in Southfield, MI with 7.5%.
What is the Percentage of Population Employed in Accommodation & Food Services in Southfield, MI?
Percentage of Population Employed in Accommodation & Food Services in Southfield is 4.7%.
What is the Percentage of Population Employed in Accommodation & Food Services in Michigan?
Percentage of Population Employed in Accommodation & Food Services in Michigan is 7.1%.
What is the Percentage of Population Employed in Accommodation & Food Services in the United States?
Percentage of Population Employed in Accommodation & Food Services in the United States is 6.9%.