Zip Codes with the Highest Percentage of Population Employed in Real Estate, Rental & Leasing in Olathe, KS

RELATED REPORTS & OPTIONS

Real Estate, Rental & Leasing
Population
Families and Households
Female Fertility
Female Fertility (Unmarried)
Race (Community Size)
Race (Percentage)
Ancestry (Community Size)
AfricanAmericanApacheArabArgentineanArmenianAustrianBelgianBhutaneseBlackfeetBrazilianBritishBurmeseCanadianCelticCentral AmericanCherokeeChickasawChippewaChoctawColombianCreekCroatianCubanCzechCzechoslovakianDanishDutchEastern EuropeanEcuadorianEnglishEthiopianEuropeanFilipinoFinnishFrenchFrench CanadianGermanGerman RussianGreekGuatemalanHaitianHonduranHungarianIndian (Asian)IndonesianIranianIrishIroquoisItalianJamaicanKenyanKoreanLebaneseLithuanianMalaysianMexicanNative HawaiianNicaraguanNigerianNorthern EuropeanNorwegianPakistaniPalestinianPanamanianPennsylvania GermanPeruvianPolishPotawatomiPuerto RicanRomanianRussianSalvadoranSamoanScandinavianScotch-IrishScottishSlavicSloveneSouth AmericanSpaniardSpanishSri LankanSubsaharan AfricanSwedishSwissSyrianThaiUkrainianVenezuelanWelshYugoslavian
Ancestry (Percentage)
AfricanAmericanApacheArabArgentineanArmenianAustrianBelgianBhutaneseBlackfeetBrazilianBritishBurmeseCanadianCelticCentral AmericanCherokeeChickasawChippewaChoctawColombianCreekCroatianCubanCzechCzechoslovakianDanishDutchEastern EuropeanEcuadorianEnglishEthiopianEuropeanFilipinoFinnishFrenchFrench CanadianGermanGerman RussianGreekGuatemalanHaitianHonduranHungarianIndian (Asian)IndonesianIranianIrishIroquoisItalianJamaicanKenyanKoreanLebaneseLithuanianMalaysianMexicanNative HawaiianNicaraguanNigerianNorthern EuropeanNorwegianPakistaniPalestinianPanamanianPennsylvania GermanPeruvianPolishPotawatomiPuerto RicanRomanianRussianSalvadoranSamoanScandinavianScotch-IrishScottishSlavicSloveneSouth AmericanSpaniardSpanishSri LankanSubsaharan AfricanSwedishSwissSyrianThaiUkrainianVenezuelanWelshYugoslavian
Immigrant Origin (Total)
Immigrant Origin (Percentage)
Income
Income (Families)
Income (Households)
Poverty
Poverty (Families)
Unemployment
Employment Occupations
Employment Industries
Employer Class
Commute Time
Commute Means
School Enrollment
Education by Degree Field
Occupancy
Finances
Physical Characteristics
Olathe
Compare Zip Codes
Comparison Subject

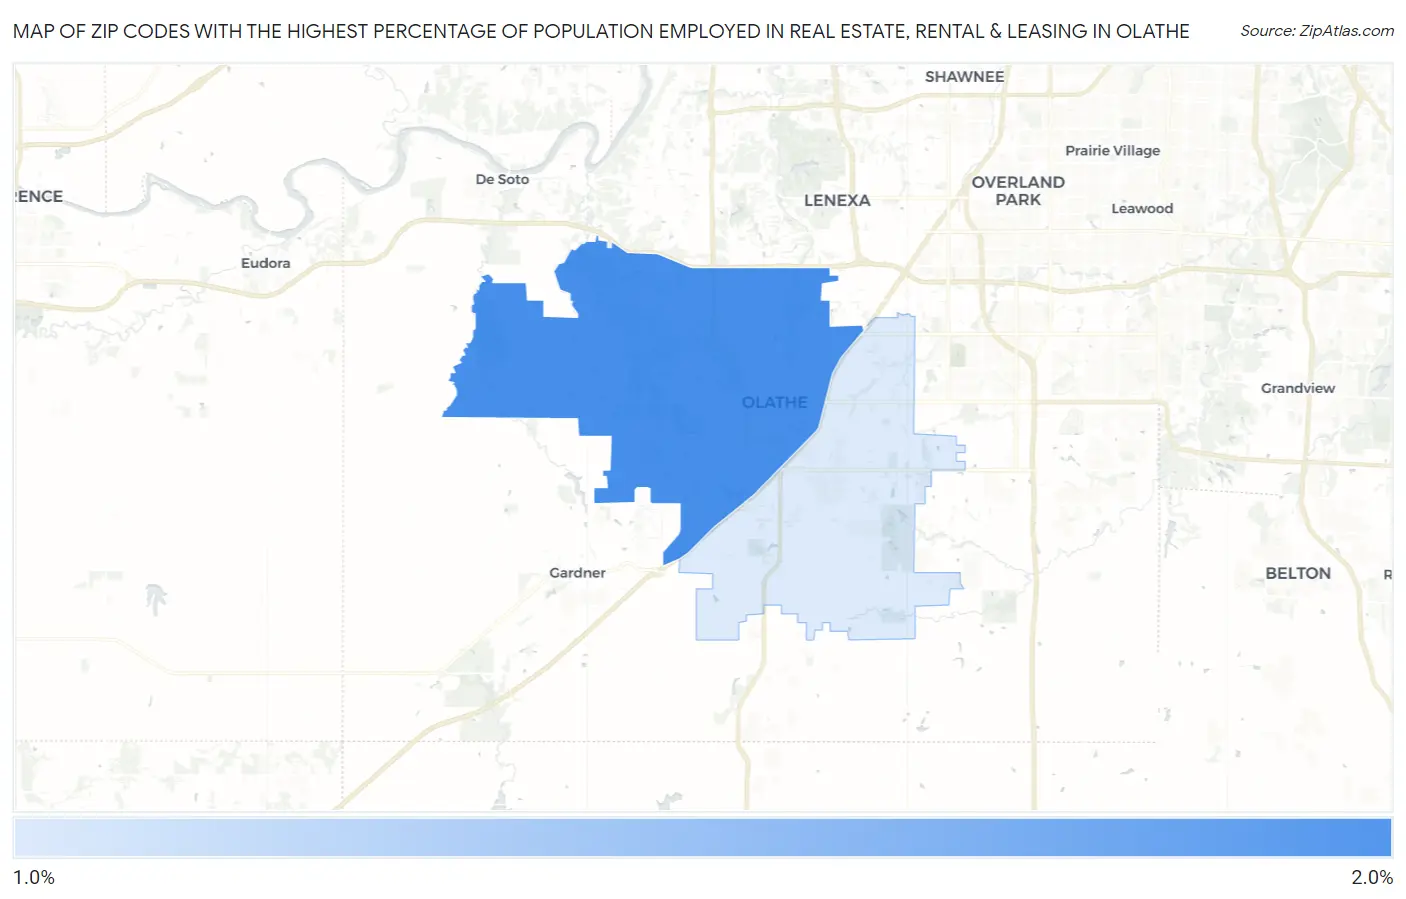
Map of Zip Codes with the Highest Percentage of Population Employed in Real Estate, Rental & Leasing in Olathe

0.0%
2.0%
Zip Codes with the Highest Percentage of Population Employed in Real Estate, Rental & Leasing in Olathe Map

Zip Codes with the Highest Percentage of Population Employed in Real Estate, Rental & Leasing in Olathe, KS

Zip Code % Employed vs State vs National
1.660611.8%1.4%(+0.438)#1011.9%(-0.076)#9,013
2.660621.4%1.4%(-0.012)#1391.9%(-0.526)#12,243

Common Questions

What are the Top Zip Codes with the Highest Percentage of Population Employed in Real Estate, Rental & Leasing in Olathe, KS?
Top Zip Codes with the Highest Percentage of Population Employed in Real Estate, Rental & Leasing in Olathe, KS are:
#1
1.8%
#2
1.4%
What zip code has the Highest Percentage of Population Employed in Real Estate, Rental & Leasing in Olathe, KS?
66061 has the Highest Percentage of Population Employed in Real Estate, Rental & Leasing in Olathe, KS with 1.8%.
What is the Percentage of Population Employed in Real Estate, Rental & Leasing in Olathe, KS?
Percentage of Population Employed in Real Estate, Rental & Leasing in Olathe is 1.6%.
What is the Percentage of Population Employed in Real Estate, Rental & Leasing in Kansas?
Percentage of Population Employed in Real Estate, Rental & Leasing in Kansas is 1.4%.
What is the Percentage of Population Employed in Real Estate, Rental & Leasing in the United States?
Percentage of Population Employed in Real Estate, Rental & Leasing in the United States is 1.9%.