Zip Codes with the Highest Percentage of Population Employed in Community & Social Service in Overland Park, KS

RELATED REPORTS & OPTIONS

Community & Social Service
Population
Families and Households
Female Fertility
Female Fertility (Unmarried)
Race (Community Size)
Race (Percentage)
Ancestry (Community Size)
AfghanAfricanAlbanianAmericanApacheArabArgentineanArmenianAustralianAustrianBelgianBhutaneseBlackfeetBrazilianBritishBulgarianBurmeseCanadianCelticCentral AmericanCentral American IndianCherokeeChippewaChoctawColombianCreekCroatianCubanCzechCzechoslovakianDanishDelawareDominicanDutchEastern EuropeanEgyptianEnglishEthiopianEuropeanFilipinoFinnishFrenchFrench CanadianGermanGreekGuamanian / ChamorroGuatemalanHaitianHonduranHungarianIndian (Asian)IranianIraqiIrishIsraeliItalianJamaicanJapaneseJordanianKenyanKoreanLaotianLatvianLebaneseLithuanianLuxembourgerMalaysianMexicanMexican American IndianMongolianNative HawaiianNavajoNigerianNorthern EuropeanNorwegianPakistaniPalestinianPanamanianParaguayanPennsylvania GermanPeruvianPolishPortuguesePotawatomiPuerto RicanRomanianRussianSalvadoranScandinavianScotch-IrishScottishSeminoleSerbianSiouxSlavicSlovakSloveneSouth AfricanSouth AmericanSpaniardSpanishSri LankanSubsaharan AfricanSudaneseSwedishSwissSyrianThaiTrinidadian and TobagonianTurkishUkrainianVenezuelanVietnameseWelshWest Indian
Ancestry (Percentage)
AfghanAfricanAlbanianAmericanApacheArabArgentineanArmenianAustralianAustrianBelgianBhutaneseBlackfeetBrazilianBritishBulgarianBurmeseCanadianCelticCentral AmericanCentral American IndianCherokeeChippewaChoctawColombianCreekCroatianCubanCzechCzechoslovakianDanishDelawareDominicanDutchEastern EuropeanEgyptianEnglishEthiopianEuropeanFilipinoFinnishFrenchFrench CanadianGermanGreekGuamanian / ChamorroGuatemalanHaitianHonduranHungarianIndian (Asian)IranianIraqiIrishIsraeliItalianJamaicanJapaneseJordanianKenyanKoreanLaotianLatvianLebaneseLithuanianLuxembourgerMalaysianMexicanMexican American IndianMongolianNative HawaiianNavajoNigerianNorthern EuropeanNorwegianPakistaniPalestinianPanamanianParaguayanPennsylvania GermanPeruvianPolishPortuguesePotawatomiPuerto RicanRomanianRussianSalvadoranScandinavianScotch-IrishScottishSeminoleSerbianSiouxSlavicSlovakSloveneSouth AfricanSouth AmericanSpaniardSpanishSri LankanSubsaharan AfricanSudaneseSwedishSwissSyrianThaiTrinidadian and TobagonianTurkishUkrainianVenezuelanVietnameseWelshWest Indian
Immigrant Origin (Total)
Immigrant Origin (Percentage)
Income
Income (Families)
Income (Households)
Poverty
Poverty (Families)
Unemployment
Employment Occupations
Employment Industries
Employer Class
Commute Time
Commute Means
School Enrollment
Education by Degree Field
Occupancy
Finances
Physical Characteristics
Overland Park
Compare Zip Codes
Comparison Subject

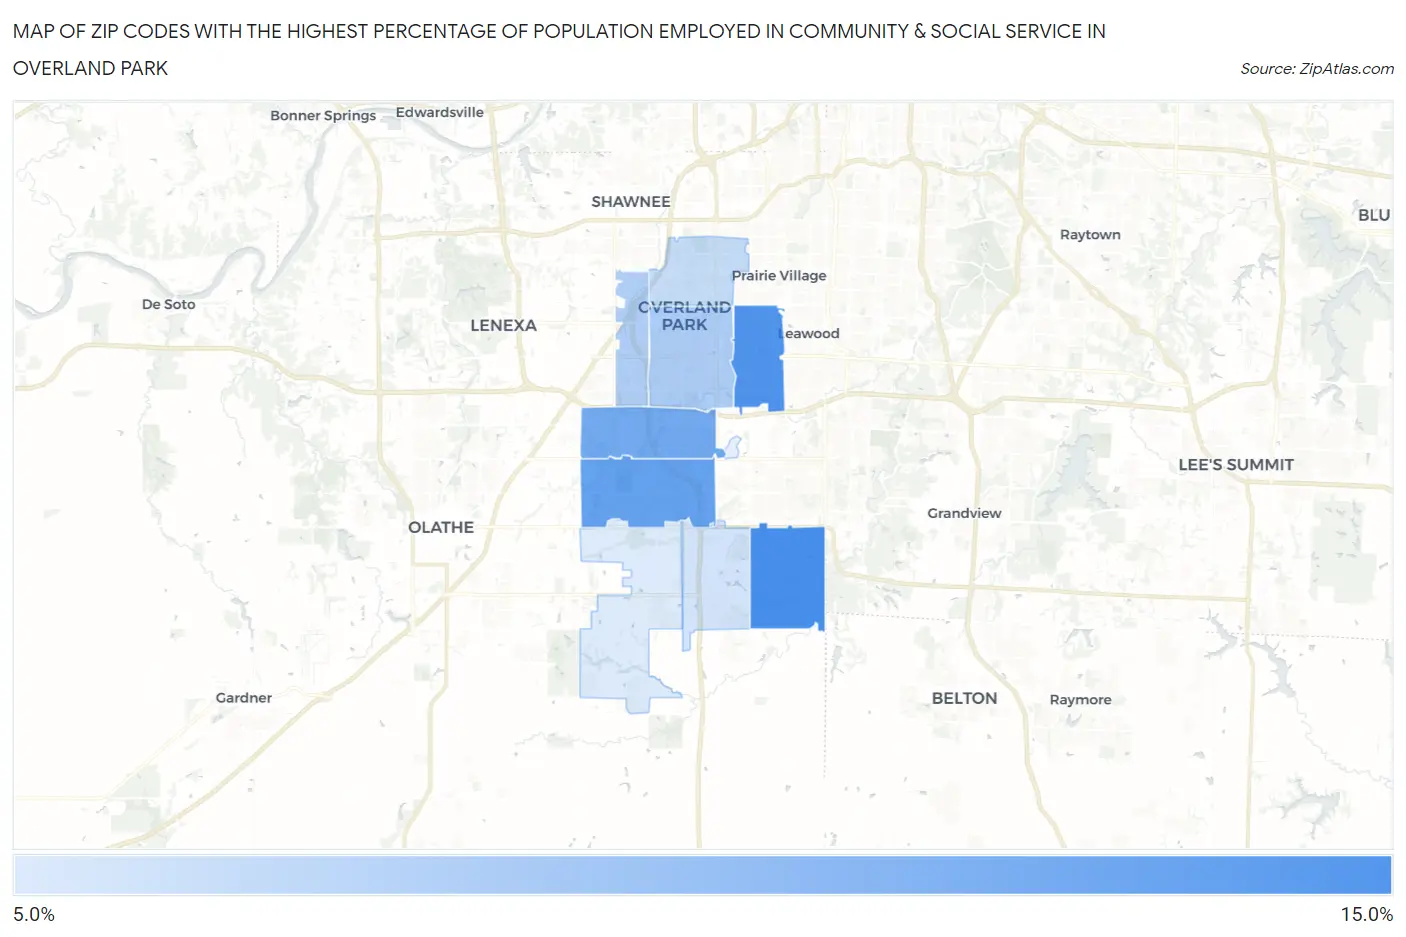
Map of Zip Codes with the Highest Percentage of Population Employed in Community & Social Service in Overland Park

0.0%
15.0%
Zip Codes with the Highest Percentage of Population Employed in Community & Social Service  in Overland Park Map

Zip Codes with the Highest Percentage of Population Employed in Community & Social Service in Overland Park, KS

Zip Code % Employed vs State vs National
1.6622414.2%11.3%(+2.87)#13111.2%(+2.94)#5,893
2.6620713.9%11.3%(+2.63)#13611.2%(+2.70)#6,195
3.6621313.4%11.3%(+2.12)#15311.2%(+2.19)#6,898
4.6621013.1%11.3%(+1.78)#16511.2%(+1.85)#7,448
5.6621211.7%11.3%(+0.409)#21811.2%(+0.480)#10,011
6.6621411.7%11.3%(+0.371)#22111.2%(+0.441)#10,105
7.6620411.1%11.3%(-0.186)#25911.2%(-0.115)#11,391
8.6622310.8%11.3%(-0.439)#27211.2%(-0.369)#12,023
9.6622110.6%11.3%(-0.720)#29011.2%(-0.649)#12,717

Common Questions

What are the Top 5 Zip Codes with the Highest Percentage of Population Employed in Community & Social Service in Overland Park, KS?
Top 5 Zip Codes with the Highest Percentage of Population Employed in Community & Social Service in Overland Park, KS are:
#1
14.2%
#2
13.9%
#3
13.4%
#4
13.1%
#5
11.7%
What zip code has the Highest Percentage of Population Employed in Community & Social Service in Overland Park, KS?
66224 has the Highest Percentage of Population Employed in Community & Social Service in Overland Park, KS with 14.2%.
What is the Percentage of Population Employed in Community & Social Service in Overland Park, KS?
Percentage of Population Employed in Community & Social Service in Overland Park is 12.5%.
What is the Percentage of Population Employed in Community & Social Service in Kansas?
Percentage of Population Employed in Community & Social Service in Kansas is 11.3%.
What is the Percentage of Population Employed in Community & Social Service in the United States?
Percentage of Population Employed in Community & Social Service in the United States is 11.2%.