Immigrants from Syria vs Immigrants from Zaire Wage/Income Gap
COMPARE
Immigrants from Syria
Immigrants from Zaire
Wage/Income Gap
Wage/Income Gap Comparison
Immigrants from Syria
Immigrants from Zaire
26.4%
WAGE/INCOME GAP
19.3/ 100
METRIC RATING
201st/ 347
METRIC RANK
22.3%
WAGE/INCOME GAP
100.0/ 100
METRIC RATING
55th/ 347
METRIC RANK
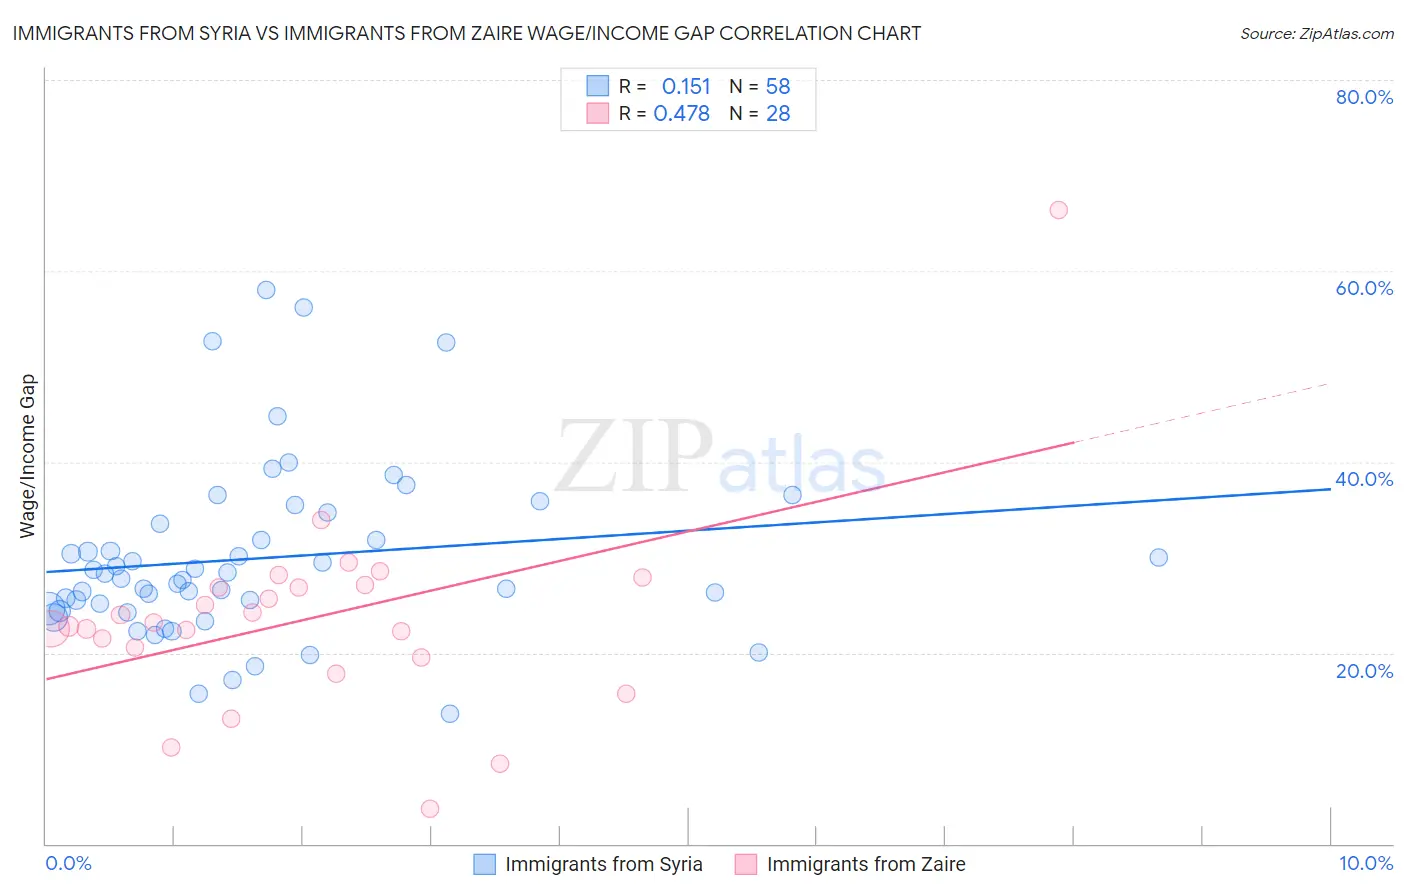
Immigrants from Syria vs Immigrants from Zaire Wage/Income Gap Correlation Chart
The statistical analysis conducted on geographies consisting of 174,099,463 people shows a poor positive correlation between the proportion of Immigrants from Syria and wage/income gap percentage in the United States with a correlation coefficient (R) of 0.151 and weighted average of 26.4%. Similarly, the statistical analysis conducted on geographies consisting of 107,239,731 people shows a moderate positive correlation between the proportion of Immigrants from Zaire and wage/income gap percentage in the United States with a correlation coefficient (R) of 0.478 and weighted average of 22.3%, a difference of 18.2%.
Wage/Income Gap Correlation Summary
| Measurement | Immigrants from Syria | Immigrants from Zaire |
| Minimum | 13.6% | 3.7% |
| Maximum | 58.0% | 66.4% |
| Range | 44.4% | 62.8% |
| Mean | 29.9% | 23.6% |
| Median | 28.0% | 23.0% |
| Interquartile 25% (IQ1) | 24.7% | 20.1% |
| Interquartile 75% (IQ3) | 33.5% | 27.0% |
| Interquartile Range (IQR) | 8.8% | 6.9% |
| Standard Deviation (Sample) | 9.2% | 10.8% |
| Standard Deviation (Population) | 9.1% | 10.6% |
Similar Demographics by Wage/Income Gap
Demographics Similar to Immigrants from Syria by Wage/Income Gap
In terms of wage/income gap, the demographic groups most similar to Immigrants from Syria are Laotian (26.4%, a difference of 0.010%), Immigrants from Eastern Europe (26.4%, a difference of 0.010%), Immigrants from Russia (26.4%, a difference of 0.030%), Delaware (26.3%, a difference of 0.16%), and Dutch West Indian (26.3%, a difference of 0.17%).
| Demographics | Rating | Rank | Wage/Income Gap |
| Chileans | 22.3 /100 | #194 | Fair 26.3% |
| Immigrants | Malaysia | 22.2 /100 | #195 | Fair 26.3% |
| Immigrants | Western Asia | 21.7 /100 | #196 | Fair 26.3% |
| Zimbabweans | 21.6 /100 | #197 | Fair 26.3% |
| Venezuelans | 21.5 /100 | #198 | Fair 26.3% |
| Dutch West Indians | 21.0 /100 | #199 | Fair 26.3% |
| Delaware | 20.9 /100 | #200 | Fair 26.3% |
| Immigrants | Syria | 19.3 /100 | #201 | Poor 26.4% |
| Laotians | 19.2 /100 | #202 | Poor 26.4% |
| Immigrants | Eastern Europe | 19.2 /100 | #203 | Poor 26.4% |
| Immigrants | Russia | 19.0 /100 | #204 | Poor 26.4% |
| Immigrants | Southern Europe | 17.3 /100 | #205 | Poor 26.4% |
| Indians (Asian) | 16.5 /100 | #206 | Poor 26.4% |
| Immigrants | Italy | 15.8 /100 | #207 | Poor 26.5% |
| Egyptians | 12.7 /100 | #208 | Poor 26.6% |
Demographics Similar to Immigrants from Zaire by Wage/Income Gap
In terms of wage/income gap, the demographic groups most similar to Immigrants from Zaire are Immigrants from Ghana (22.3%, a difference of 0.030%), Ghanaian (22.3%, a difference of 0.13%), Immigrants from Cuba (22.4%, a difference of 0.22%), Navajo (22.4%, a difference of 0.25%), and Immigrants from Middle Africa (22.4%, a difference of 0.27%).
| Demographics | Rating | Rank | Wage/Income Gap |
| Blacks/African Americans | 100.0 /100 | #48 | Exceptional 21.7% |
| Ethiopians | 100.0 /100 | #49 | Exceptional 21.8% |
| Immigrants | Western Africa | 100.0 /100 | #50 | Exceptional 22.0% |
| Tohono O'odham | 100.0 /100 | #51 | Exceptional 22.1% |
| Immigrants | Cameroon | 100.0 /100 | #52 | Exceptional 22.2% |
| Bangladeshis | 100.0 /100 | #53 | Exceptional 22.2% |
| Nepalese | 100.0 /100 | #54 | Exceptional 22.2% |
| Immigrants | Zaire | 100.0 /100 | #55 | Exceptional 22.3% |
| Immigrants | Ghana | 100.0 /100 | #56 | Exceptional 22.3% |
| Ghanaians | 100.0 /100 | #57 | Exceptional 22.3% |
| Immigrants | Cuba | 100.0 /100 | #58 | Exceptional 22.4% |
| Navajo | 100.0 /100 | #59 | Exceptional 22.4% |
| Immigrants | Middle Africa | 100.0 /100 | #60 | Exceptional 22.4% |
| Immigrants | Fiji | 100.0 /100 | #61 | Exceptional 22.4% |
| Immigrants | Guatemala | 100.0 /100 | #62 | Exceptional 22.5% |