Immigrants from Cabo Verde Wage/Income Gap

COMPARE

Immigrants from Cabo Verde
Race
Ancestry
AfghanAfricanAlaska NativeAlaskan AthabascanAlbanianAleutAlsatianAmericanApacheArabArapahoArgentineanArmenianAssyrian/Chaldean/SyriacAustralianAustrianBahamianBangladeshiBarbadianBasqueBelgianBelizeanBermudanBhutaneseBlackfeetBolivianBrazilianBritishBritish West IndianBulgarianBurmeseCajunCambodianCanadianCape VerdeanCarpatho RusynCelticCentral AmericanCentral American IndianCherokeeCheyenneChickasawChileanChineseChippewaChoctawColombianColvilleComancheCosta RicanCreeCreekCroatianCrowCubanCypriotCzechCzechoslovakianDanishDelawareDominicanDutchDutch West IndianEastern EuropeanEcuadorianEgyptianEnglishEstonianEthiopianEuropeanFijianFilipinoFinnishFrenchFrench American IndianFrench CanadianGermanGerman RussianGhanaianGreekGuamanian/ChamorroGuatemalanGuyaneseHaitianHmongHonduranHopiHoumaHungarianIcelanderIndian (Asian)IndonesianInupiatIranianIraqiIrishIroquoisIsraeliItalianJamaicanJapaneseJordanianKenyanKiowaKoreanLaotianLatvianLebaneseLiberianLithuanianLumbeeLuxembourgerMacedonianMalaysianMalteseMarshalleseMenomineeMexicanMexican American IndianMongolianMoroccanNative HawaiianNavajoNepaleseNew ZealanderNicaraguanNigerianNorthern EuropeanNorwegianOkinawanOsageOttawaPaiutePakistaniPalestinianPanamanianParaguayanPennsylvania GermanPeruvianPimaPolishPortuguesePotawatomiPuebloPuerto RicanPuget Sound SalishRomanianRussianSalvadoranSamoanScandinavianScotch-IrishScottishSeminoleSenegaleseSerbianShoshoneSierra LeoneanSiouxSlavicSlovakSloveneSomaliSouth AfricanSouth AmericanSouth American IndianSoviet UnionSpaniardSpanishSpanish AmericanSpanish American IndianSri LankanSubsaharan AfricanSudaneseSwedishSwissSyrianTaiwaneseThaiTlingit-HaidaTohono O'OdhamTonganTrinidadian and TobagonianTsimshianTurkishU.S. Virgin IslanderUgandanUkrainianUruguayanUteVenezuelanVietnameseWelshWest IndianYakamaYaquiYugoslavianYumanYup'ikZimbabwean
Immigration
NonimmigrantsImmigrantsAfghanistanAfricaAlbaniaArgentinaArmeniaAsiaAustraliaAustriaBahamasBangladeshBarbadosBelarusBelgiumBelizeBoliviaBosnia and HerzegovinaBrazilBulgariaBurma/MyanmarCabo VerdeCambodiaCameroonCanadaCaribbeanCentral AmericaChileChinaColombiaCongoCosta RicaCroatiaCubaCzechoslovakiaDenmarkDominicaDominican RepublicEastern AfricaEastern AsiaEastern EuropeEcuadorEgyptEl SalvadorEnglandEritreaEthiopiaEuropeFijiFranceGermanyGhanaGreeceGrenadaGuatemalaGuyanaHaitiHondurasHong KongHungaryIndiaIndonesiaIranIraqIrelandIsraelItalyJamaicaJapanJordanKazakhstanKenyaKoreaKuwaitLaosLatin AmericaLatviaLebanonLiberiaLithuaniaMalaysiaMexicoMicronesiaMiddle AfricaMoldovaMoroccoNepalNetherlandsNicaraguaNigeriaNorth AmericaNorth MacedoniaNorthern AfricaNorthern EuropeNorwayOceaniaPakistanPanamaPeruPhilippinesPolandPortugalRomaniaRussiaSaudi ArabiaScotlandSenegalSerbiaSierra LeoneSingaporeSomaliaSouth AfricaSouth AmericaSouth Central AsiaSouth Eastern AsiaSouthern EuropeSpainSri LankaSt. Vincent and the GrenadinesSudanSwedenSwitzerlandSyriaTaiwanThailandTrinidad and TobagoTurkeyUgandaUkraineUruguayUzbekistanVenezuelaVietnamWest IndiesWestern AfricaWestern AsiaWestern EuropeYemenZaireZimbabweAzores
Select to Compare
Race
Ancestry
AfghanAfricanAlaska NativeAlaskan AthabascanAlbanianAleutAlsatianAmericanApacheArabArapahoArgentineanArmenianAssyrian/Chaldean/SyriacAustralianAustrianBahamianBangladeshiBarbadianBasqueBelgianBelizeanBermudanBhutaneseBlackfeetBolivianBrazilianBritishBritish West IndianBulgarianBurmeseCajunCambodianCanadianCape VerdeanCarpatho RusynCelticCentral AmericanCentral American IndianCherokeeCheyenneChickasawChileanChineseChippewaChoctawColombianColvilleComancheCosta RicanCreeCreekCroatianCrowCubanCypriotCzechCzechoslovakianDanishDelawareDominicanDutchDutch West IndianEastern EuropeanEcuadorianEgyptianEnglishEstonianEthiopianEuropeanFijianFilipinoFinnishFrenchFrench American IndianFrench CanadianGermanGerman RussianGhanaianGreekGuamanian/ChamorroGuatemalanGuyaneseHaitianHmongHonduranHopiHoumaHungarianIcelanderIndian (Asian)IndonesianInupiatIranianIraqiIrishIroquoisIsraeliItalianJamaicanJapaneseJordanianKenyanKiowaKoreanLaotianLatvianLebaneseLiberianLithuanianLumbeeLuxembourgerMacedonianMalaysianMalteseMarshalleseMenomineeMexicanMexican American IndianMongolianMoroccanNative HawaiianNavajoNepaleseNew ZealanderNicaraguanNigerianNorthern EuropeanNorwegianOkinawanOsageOttawaPaiutePakistaniPalestinianPanamanianParaguayanPennsylvania GermanPeruvianPimaPolishPortuguesePotawatomiPuebloPuerto RicanPuget Sound SalishRomanianRussianSalvadoranSamoanScandinavianScotch-IrishScottishSeminoleSenegaleseSerbianShoshoneSierra LeoneanSiouxSlavicSlovakSloveneSomaliSouth AfricanSouth AmericanSouth American IndianSoviet UnionSpaniardSpanishSpanish AmericanSpanish American IndianSri LankanSubsaharan AfricanSudaneseSwedishSwissSyrianTaiwaneseThaiTlingit-HaidaTohono O'OdhamTonganTrinidadian and TobagonianTsimshianTurkishU.S. Virgin IslanderUgandanUkrainianUruguayanUteVenezuelanVietnameseWelshWest IndianYakamaYaquiYugoslavianYumanYup'ikZimbabwean
Immigration
NonimmigrantsImmigrantsAfghanistanAfricaAlbaniaArgentinaArmeniaAsiaAustraliaAustriaBahamasBangladeshBarbadosBelarusBelgiumBelizeBoliviaBosnia and HerzegovinaBrazilBulgariaBurma/MyanmarCambodiaCameroonCanadaCaribbeanCentral AmericaChileChinaColombiaCongoCosta RicaCroatiaCubaCzechoslovakiaDenmarkDominicaDominican RepublicEastern AfricaEastern AsiaEastern EuropeEcuadorEgyptEl SalvadorEnglandEritreaEthiopiaEuropeFijiFranceGermanyGhanaGreeceGrenadaGuatemalaGuyanaHaitiHondurasHong KongHungaryIndiaIndonesiaIranIraqIrelandIsraelItalyJamaicaJapanJordanKazakhstanKenyaKoreaKuwaitLaosLatin AmericaLatviaLebanonLiberiaLithuaniaMalaysiaMexicoMicronesiaMiddle AfricaMoldovaMoroccoNepalNetherlandsNicaraguaNigeriaNorth AmericaNorth MacedoniaNorthern AfricaNorthern EuropeNorwayOceaniaPakistanPanamaPeruPhilippinesPolandPortugalRomaniaRussiaSaudi ArabiaScotlandSenegalSerbiaSierra LeoneSingaporeSomaliaSouth AfricaSouth AmericaSouth Central AsiaSouth Eastern AsiaSouthern EuropeSpainSri LankaSt. Vincent and the GrenadinesSudanSwedenSwitzerlandSyriaTaiwanThailandTrinidad and TobagoTurkeyUgandaUkraineUruguayUzbekistanVenezuelaVietnamWest IndiesWestern AfricaWestern AsiaWestern EuropeYemenZaireZimbabweAzores
Wage/Income Gap
Income
Poverty
Unemployment
Labor Participation
Family Structure
Vehicle Availability
Education Level
Disability

Immigrants from Cabo Verde Wage/Income Gap
Exceptional

23.6%
WAGE/INCOME GAP
99.5/ 100
METRIC RATING
93rd/ 347
METRIC RANK

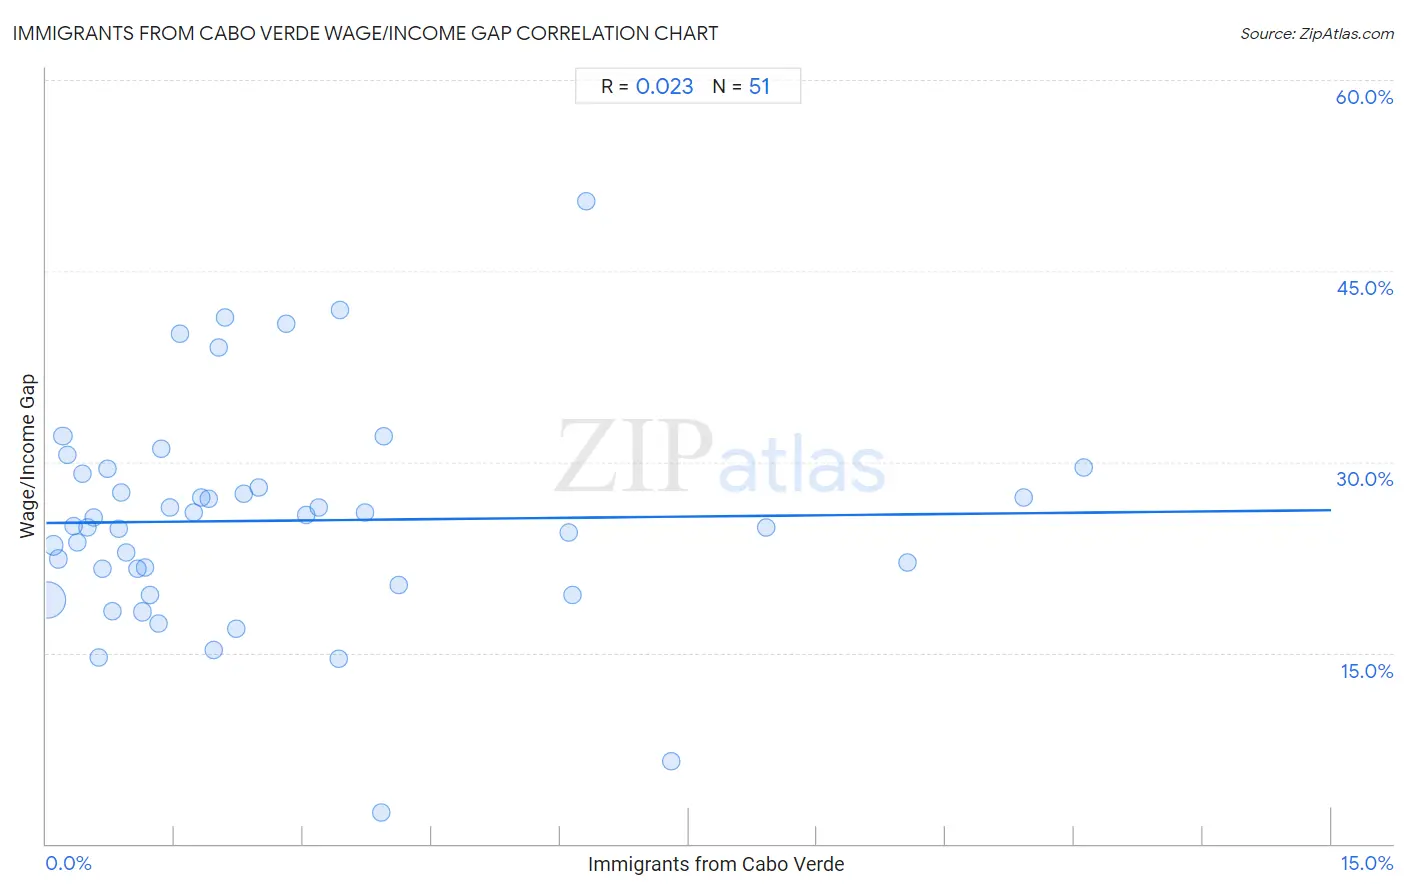
Immigrants from Cabo Verde Wage/Income Gap Correlation Chart

The statistical analysis conducted on geographies consisting of 38,157,799 people shows no correlation between the proportion of Immigrants from Cabo Verde and wage/income gap percentage in the United States with a correlation coefficient (R) of 0.023 and weighted average of 23.6%. On average, for every 1% (one percent) increase in Immigrants from Cabo Verde within a typical geography, there is an increase of 0.067% in wage/income gap percentage.
Immigrants from Cabo Verde Wage/Income Gap
It is essential to understand that the correlation between the percentage of Immigrants from Cabo Verde and wage/income gap percentage does not imply a direct cause-and-effect relationship. It remains uncertain whether the presence of Immigrants from Cabo Verde influences an upward or downward trend in the level of wage/income gap percentage within an area, or if Immigrants from Cabo Verde simply ended up residing in those areas with higher or lower levels of wage/income gap percentage due to other factors.

Demographics Similar to Immigrants from Cabo Verde by Wage/Income Gap

In terms of wage/income gap, the demographic groups most similar to Immigrants from Cabo Verde are Honduran (23.6%, a difference of 0.090%), Cape Verdean (23.6%, a difference of 0.12%), Immigrants from Honduras (23.5%, a difference of 0.24%), Kiowa (23.6%, a difference of 0.24%), and Immigrants from Sudan (23.6%, a difference of 0.33%).
DemographicsRating | RankWage/Income Gap
Cheyenne
99.7
/100
|
#86
Exceptional
23.3%
Yuman
99.7
/100
|
#87
Exceptional
23.3%
Immigrants from Panama
99.6
/100
|
#88
Exceptional
23.4%
Marshallese
99.6
/100
|
#89
Exceptional
23.4%
Nicaraguans
99.6
/100
|
#90
Exceptional
23.4%
Arapaho
99.6
/100
|
#91
Exceptional
23.5%
Immigrants from Honduras
99.5
/100
|
#92
Exceptional
23.5%
Immigrants from Cabo Verde
99.5
/100
|
#93
Exceptional
23.6%
Hondurans
99.5
/100
|
#94
Exceptional
23.6%
Cape Verdeans
99.4
/100
|
#95
Exceptional
23.6%
Kiowa
99.4
/100
|
#96
Exceptional
23.6%
Immigrants from Sudan
99.4
/100
|
#97
Exceptional
23.6%
Immigrants from Latin America
99.2
/100
|
#98
Exceptional
23.7%
Aleuts
99.2
/100
|
#99
Exceptional
23.7%
Yakama
99.2
/100
|
#100
Exceptional
23.7%

Immigrants from Cabo Verde Wage/Income Gap Correlation Summary

MeasurementImmigrants from Cabo Verde DataWage/Income Gap Data
Minimum0.0084%2.5%
Maximum12.1%50.5%
Range12.1%48.0%
Mean2.7%25.4%
Median1.7%25.0%
Interquartile 25% (IQ1)0.72%20.3%
Interquartile 75% (IQ3)3.4%29.1%
Interquartile Range (IQR)2.7%8.8%
Standard Deviation (Sample)2.9%8.6%
Standard Deviation (Population)2.9%8.5%

Correlation Details

Immigrants from Cabo Verde PercentileSample SizeWage/Income Gap
[
0.0%
-
0.5%
]
0.0084%
29,053,37419.1%
[
0.0%
-
0.5%
]
0.081%
2,780,21823.5%
[
0.0%
-
0.5%
]
0.14%
1,300,89622.4%
[
0.0%
-
0.5%
]
0.19%
726,40832.0%
[
0.0%
-
0.5%
]
0.25%
413,35330.6%
[
0.0%
-
0.5%
]
0.32%
425,09625.0%
[
0.0%
-
0.5%
]
0.37%
372,90023.7%
[
0.0%
-
0.5%
]
0.42%
110,04629.1%
[
0.0%
-
0.5%
]
0.48%
269,03424.8%
[
0.5%
-
1.0%
]
0.56%
75,87725.6%
[
0.5%
-
1.0%
]
0.62%
73,65914.6%
[
0.5%
-
1.0%
]
0.66%
63,73121.6%
[
0.5%
-
1.0%
]
0.72%
28,08029.5%
[
0.5%
-
1.0%
]
0.78%
161,66318.3%
[
0.5%
-
1.0%
]
0.85%
27,75324.8%
[
0.5%
-
1.0%
]
0.88%
86,19227.6%
[
0.5%
-
1.0%
]
0.93%
49,71822.9%
[
1.0%
-
1.5%
]
1.07%
85,45621.6%
[
1.0%
-
1.5%
]
1.13%
107,39818.2%
[
1.0%
-
1.5%
]
1.16%
29,83321.7%
[
1.0%
-
1.5%
]
1.21%
60,93819.5%
[
1.0%
-
1.5%
]
1.31%
724,24017.3%
[
1.0%
-
1.5%
]
1.34%
48,69431.1%
[
1.0%
-
1.5%
]
1.44%
110,23726.4%
[
1.5%
-
2.0%
]
1.56%
7,69040.1%
[
1.5%
-
2.0%
]
1.72%
2,72626.0%
[
1.5%
-
2.0%
]
1.80%
94327.2%
[
1.5%
-
2.0%
]
1.90%
25,08427.1%
[
1.5%
-
2.0%
]
1.95%
29,82015.3%
[
2.0%
-
2.5%
]
2.02%
17,16439.0%
[
2.0%
-
2.5%
]
2.08%
29,98341.4%
[
2.0%
-
2.5%
]
2.22%
27,52716.9%
[
2.0%
-
2.5%
]
2.31%
59,43627.5%
[
2.0%
-
2.5%
]
2.48%
51,91528.0%
[
2.5%
-
3.0%
]
2.80%
18,44540.8%
[
3.0%
-
3.5%
]
3.04%
100,62025.8%
[
3.0%
-
3.5%
]
3.18%
46,62326.5%
[
3.0%
-
3.5%
]
3.42%
26,82114.5%
[
3.0%
-
3.5%
]
3.43%
12,46541.9%
[
3.5%
-
4.0%
]
3.73%
44,71826.1%
[
3.5%
-
4.0%
]
3.91%
55,3362.5%
[
3.5%
-
4.0%
]
3.94%
5,07432.0%
[
4.0%
-
4.5%
]
4.11%
16,28620.3%
[
6.0%
-
6.5%
]
6.09%
31,90324.5%
[
6.0%
-
6.5%
]
6.14%
75,17619.6%
[
6.0%
-
6.5%
]
6.30%
5,44250.5%
[
7.0%
-
7.5%
]
7.30%
24,7056.5%
[
8.0%
-
8.5%
]
8.40%
47,67724.8%
[
10.0%
-
10.5%
]
10.06%
35,48822.1%
[
11.0%
-
11.5%
]
11.41%
104,71327.2%
[
12.0%
-
12.5%
]
12.11%
69,22529.6%