Austrian vs South African Wage/Income Gap
COMPARE
Austrian
South African
Wage/Income Gap
Wage/Income Gap Comparison
Austrians
South Africans
28.4%
WAGE/INCOME GAP
0.2/ 100
METRIC RATING
298th/ 347
METRIC RANK
28.0%
WAGE/INCOME GAP
0.5/ 100
METRIC RATING
282nd/ 347
METRIC RANK
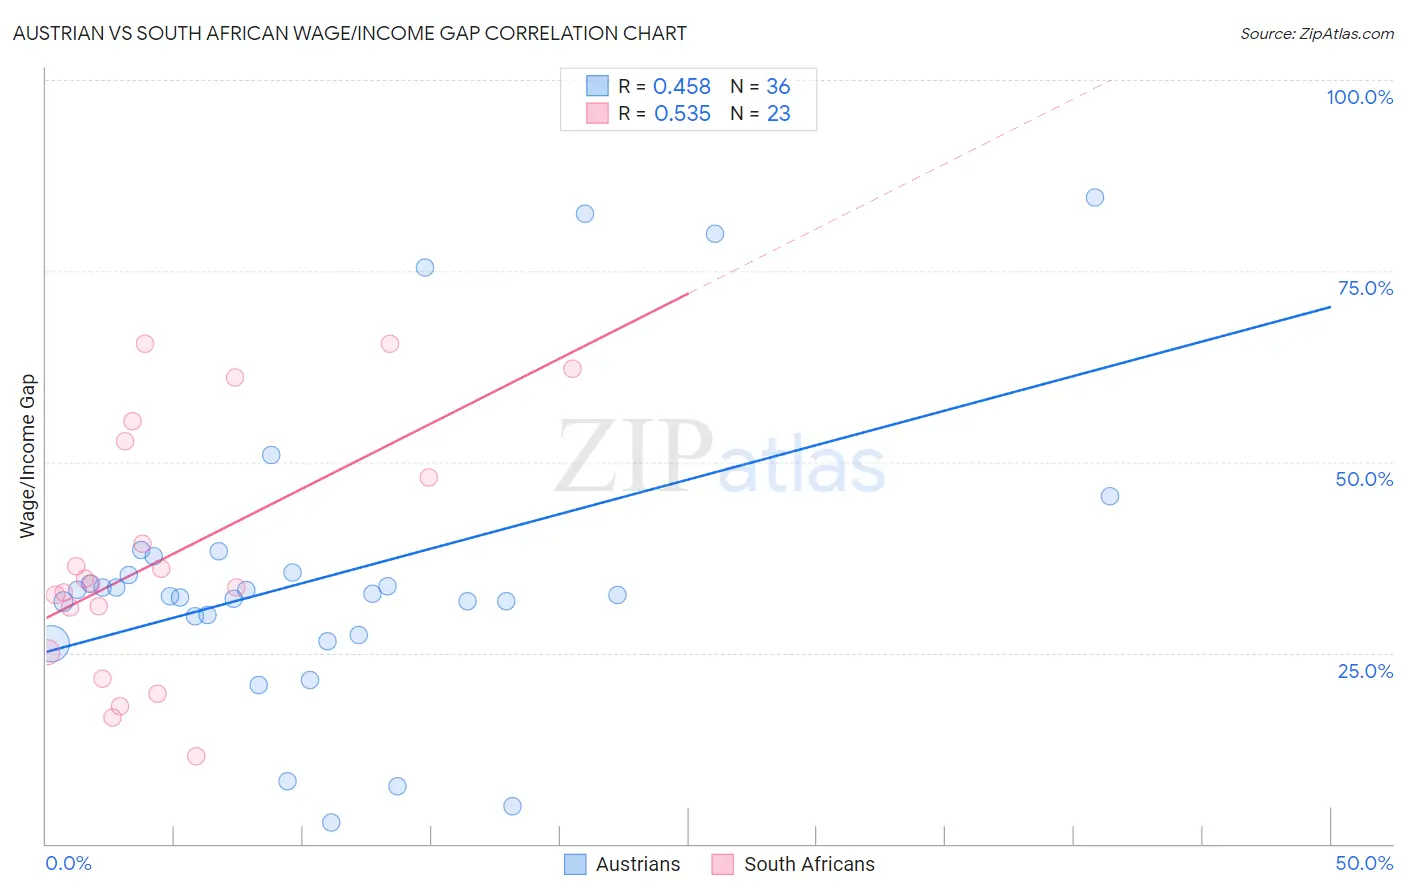
Austrian vs South African Wage/Income Gap Correlation Chart
The statistical analysis conducted on geographies consisting of 451,520,484 people shows a moderate positive correlation between the proportion of Austrians and wage/income gap percentage in the United States with a correlation coefficient (R) of 0.458 and weighted average of 28.4%. Similarly, the statistical analysis conducted on geographies consisting of 182,544,146 people shows a substantial positive correlation between the proportion of South Africans and wage/income gap percentage in the United States with a correlation coefficient (R) of 0.535 and weighted average of 28.0%, a difference of 1.4%.
Wage/Income Gap Correlation Summary
| Measurement | Austrian | South African |
| Minimum | 2.8% | 11.5% |
| Maximum | 84.6% | 65.5% |
| Range | 81.9% | 54.0% |
| Mean | 35.2% | 37.6% |
| Median | 32.6% | 34.0% |
| Interquartile 25% (IQ1) | 28.6% | 25.1% |
| Interquartile 75% (IQ3) | 36.7% | 52.7% |
| Interquartile Range (IQR) | 8.1% | 27.6% |
| Standard Deviation (Sample) | 19.2% | 16.2% |
| Standard Deviation (Population) | 18.9% | 15.9% |
Demographics Similar to Austrians and South Africans by Wage/Income Gap
In terms of wage/income gap, the demographic groups most similar to Austrians are Immigrants from North America (28.4%, a difference of 0.0%), Immigrants from North Macedonia (28.4%, a difference of 0.050%), Immigrants from Northern Europe (28.5%, a difference of 0.16%), Northern European (28.3%, a difference of 0.43%), and Slovene (28.3%, a difference of 0.44%). Similarly, the demographic groups most similar to South Africans are Burmese (28.0%, a difference of 0.030%), Russian (28.0%, a difference of 0.080%), French Canadian (28.1%, a difference of 0.18%), Immigrants from Sweden (28.1%, a difference of 0.18%), and Italian (28.1%, a difference of 0.31%).
| Demographics | Rating | Rank | Wage/Income Gap |
| Russians | 0.5 /100 | #280 | Tragic 28.0% |
| Burmese | 0.5 /100 | #281 | Tragic 28.0% |
| South Africans | 0.5 /100 | #282 | Tragic 28.0% |
| French Canadians | 0.4 /100 | #283 | Tragic 28.1% |
| Immigrants | Sweden | 0.4 /100 | #284 | Tragic 28.1% |
| Italians | 0.4 /100 | #285 | Tragic 28.1% |
| Immigrants | Austria | 0.4 /100 | #286 | Tragic 28.1% |
| Okinawans | 0.4 /100 | #287 | Tragic 28.1% |
| Choctaw | 0.4 /100 | #288 | Tragic 28.1% |
| Canadians | 0.3 /100 | #289 | Tragic 28.1% |
| Australians | 0.3 /100 | #290 | Tragic 28.2% |
| Czechoslovakians | 0.3 /100 | #291 | Tragic 28.2% |
| Immigrants | Australia | 0.3 /100 | #292 | Tragic 28.2% |
| Immigrants | Israel | 0.3 /100 | #293 | Tragic 28.2% |
| Greeks | 0.3 /100 | #294 | Tragic 28.2% |
| Slovenes | 0.3 /100 | #295 | Tragic 28.3% |
| Northern Europeans | 0.3 /100 | #296 | Tragic 28.3% |
| Immigrants | North America | 0.2 /100 | #297 | Tragic 28.4% |
| Austrians | 0.2 /100 | #298 | Tragic 28.4% |
| Immigrants | North Macedonia | 0.2 /100 | #299 | Tragic 28.4% |
| Immigrants | Northern Europe | 0.2 /100 | #300 | Tragic 28.5% |