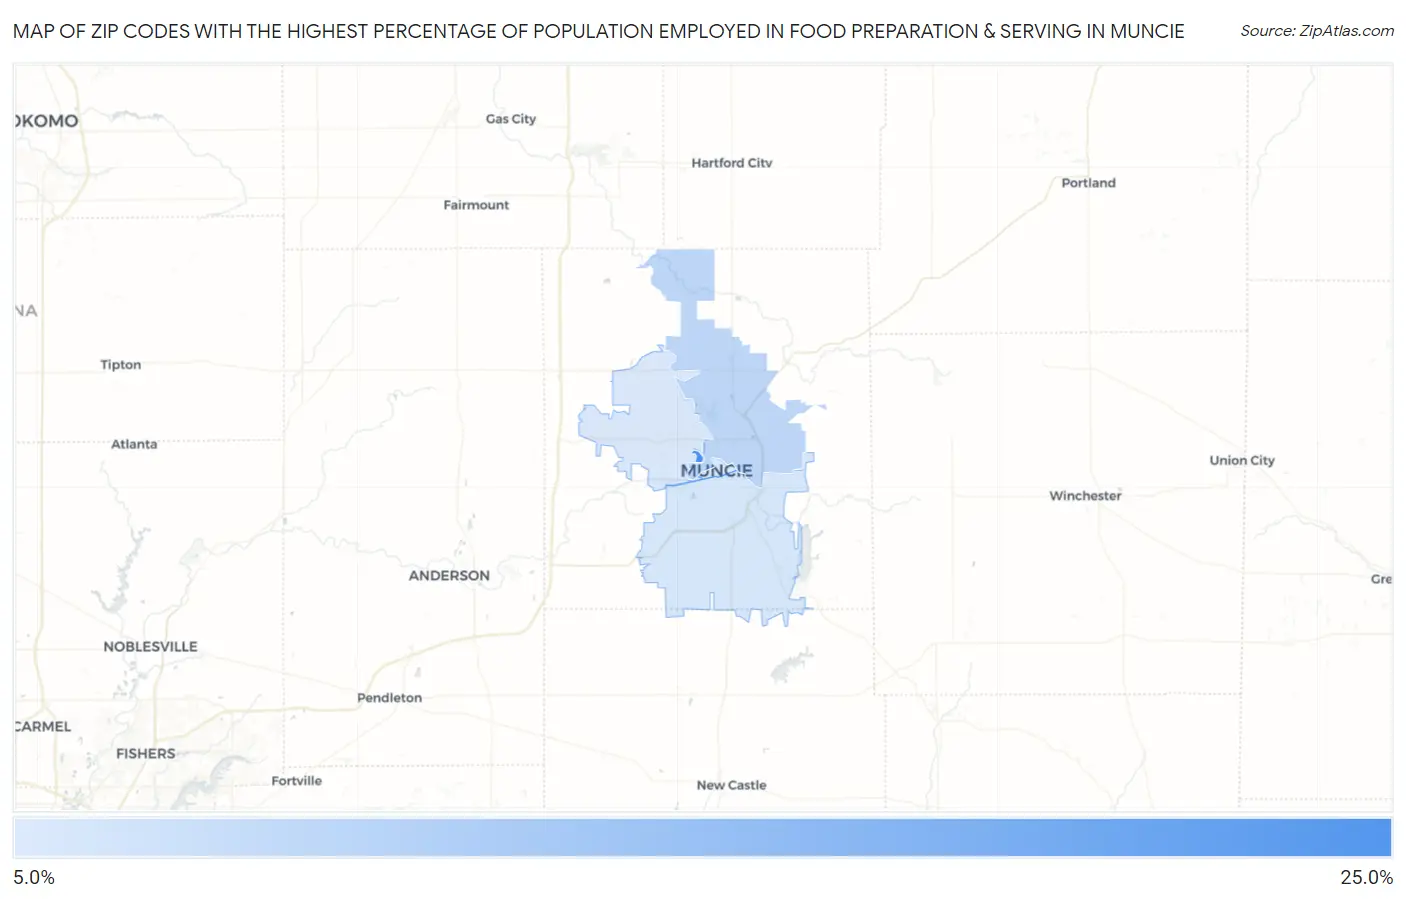
Zip Codes with the Highest Percentage of Population Employed in Food Preparation & Serving in Muncie, IN
RELATED REPORTS & OPTIONS
Food Preparation & Serving
Muncie
Compare Zip Codes
Map of Zip Codes with the Highest Percentage of Population Employed in Food Preparation & Serving in Muncie
5.2%
24.5%
Zip Codes with the Highest Percentage of Population Employed in Food Preparation & Serving in Muncie, IN
| Zip Code | % Employed | vs State | vs National | |
| 1. | 47306 | 24.5% | 5.3%(+19.2)#4 | 5.3%(+19.3)#326 |
| 2. | 47303 | 9.0% | 5.3%(+3.71)#78 | 5.3%(+3.73)#3,510 |
| 3. | 47302 | 5.9% | 5.3%(+0.618)#244 | 5.3%(+0.647)#9,564 |
| 4. | 47304 | 5.6% | 5.3%(+0.301)#269 | 5.3%(+0.329)#10,656 |
| 5. | 47305 | 5.2% | 5.3%(-0.156)#314 | 5.3%(-0.128)#12,330 |
1
Common Questions
What are the Top 3 Zip Codes with the Highest Percentage of Population Employed in Food Preparation & Serving in Muncie, IN?
Top 3 Zip Codes with the Highest Percentage of Population Employed in Food Preparation & Serving in Muncie, IN are:
What zip code has the Highest Percentage of Population Employed in Food Preparation & Serving in Muncie, IN?
47306 has the Highest Percentage of Population Employed in Food Preparation & Serving in Muncie, IN with 24.5%.
What is the Percentage of Population Employed in Food Preparation & Serving in Muncie, IN?
Percentage of Population Employed in Food Preparation & Serving in Muncie is 8.7%.
What is the Percentage of Population Employed in Food Preparation & Serving in Indiana?
Percentage of Population Employed in Food Preparation & Serving in Indiana is 5.3%.
What is the Percentage of Population Employed in Food Preparation & Serving in the United States?
Percentage of Population Employed in Food Preparation & Serving in the United States is 5.3%.