Zip Codes with the Highest Percentage of Population Employed in Arts, Media & Entertainment in Muncie, IN
RELATED REPORTS & OPTIONS
Arts, Media & Entertainment
Muncie
Compare Zip Codes
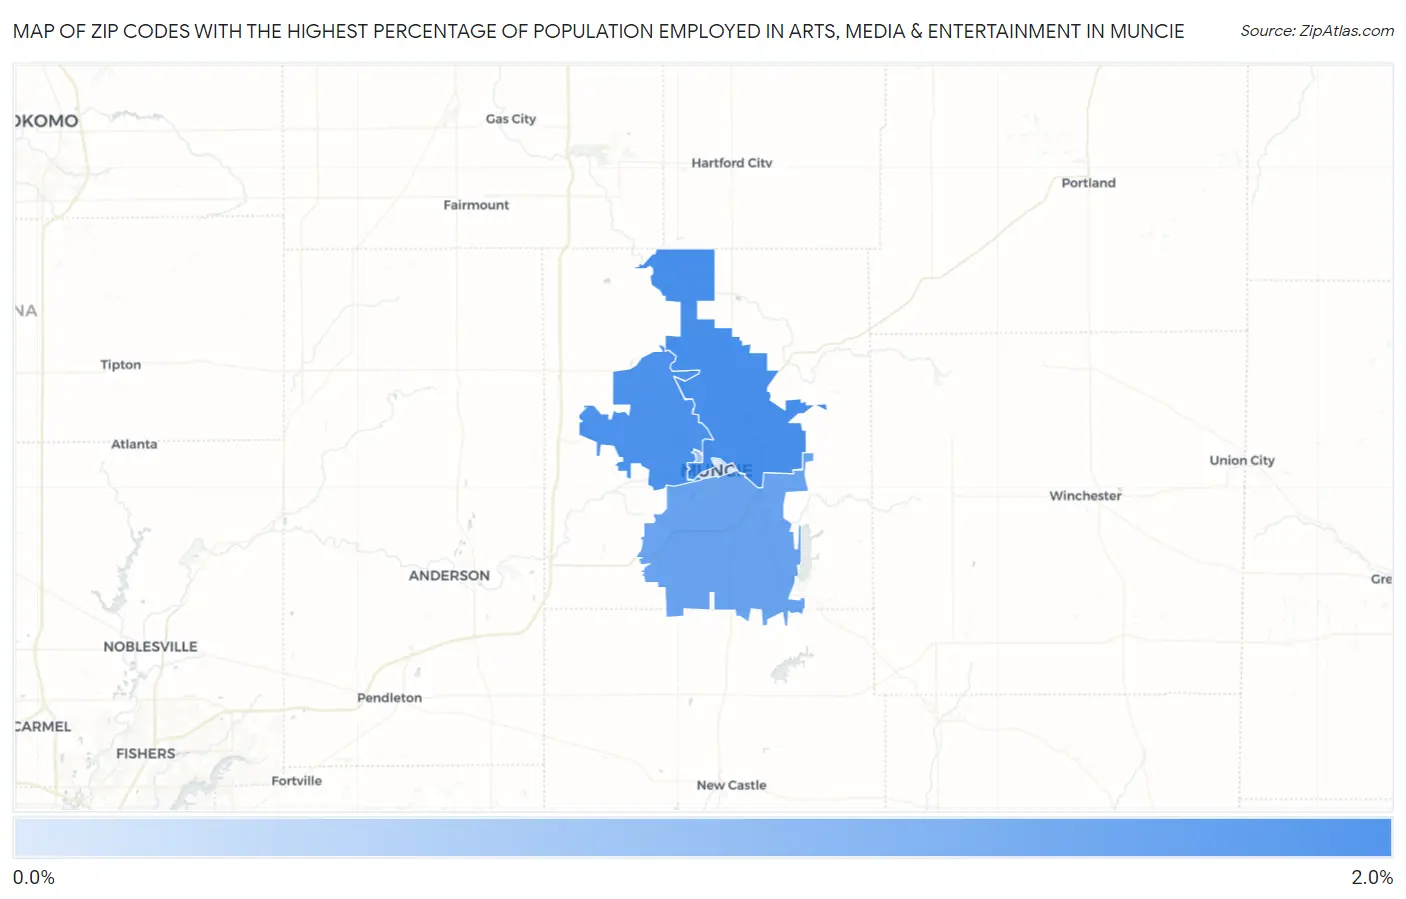
Map of Zip Codes with the Highest Percentage of Population Employed in Arts, Media & Entertainment in Muncie
0.69%
1.7%
Zip Codes with the Highest Percentage of Population Employed in Arts, Media & Entertainment in Muncie, IN
| Zip Code | % Employed | vs State | vs National | |
| 1. | 47303 | 1.7% | 1.4%(+0.324)#148 | 2.1%(-0.324)#9,360 |
| 2. | 47304 | 1.7% | 1.4%(+0.300)#151 | 2.1%(-0.349)#9,525 |
| 3. | 47302 | 1.5% | 1.4%(+0.091)#183 | 2.1%(-0.558)#10,971 |
| 4. | 47306 | 1.2% | 1.4%(-0.258)#243 | 2.1%(-0.907)#13,557 |
| 5. | 47305 | 0.69% | 1.4%(-0.719)#356 | 2.1%(-1.37)#17,312 |
1
Common Questions
What are the Top 3 Zip Codes with the Highest Percentage of Population Employed in Arts, Media & Entertainment in Muncie, IN?
Top 3 Zip Codes with the Highest Percentage of Population Employed in Arts, Media & Entertainment in Muncie, IN are:
What zip code has the Highest Percentage of Population Employed in Arts, Media & Entertainment in Muncie, IN?
47303 has the Highest Percentage of Population Employed in Arts, Media & Entertainment in Muncie, IN with 1.7%.
What is the Percentage of Population Employed in Arts, Media & Entertainment in Muncie, IN?
Percentage of Population Employed in Arts, Media & Entertainment in Muncie is 2.0%.
What is the Percentage of Population Employed in Arts, Media & Entertainment in Indiana?
Percentage of Population Employed in Arts, Media & Entertainment in Indiana is 1.4%.
What is the Percentage of Population Employed in Arts, Media & Entertainment in the United States?
Percentage of Population Employed in Arts, Media & Entertainment in the United States is 2.1%.