Zip Codes with the Highest Percentage of Households with Income Above $100,000 in Muncie, IN
RELATED REPORTS & OPTIONS
Household Income | $100k+
Muncie
Compare Zip Codes
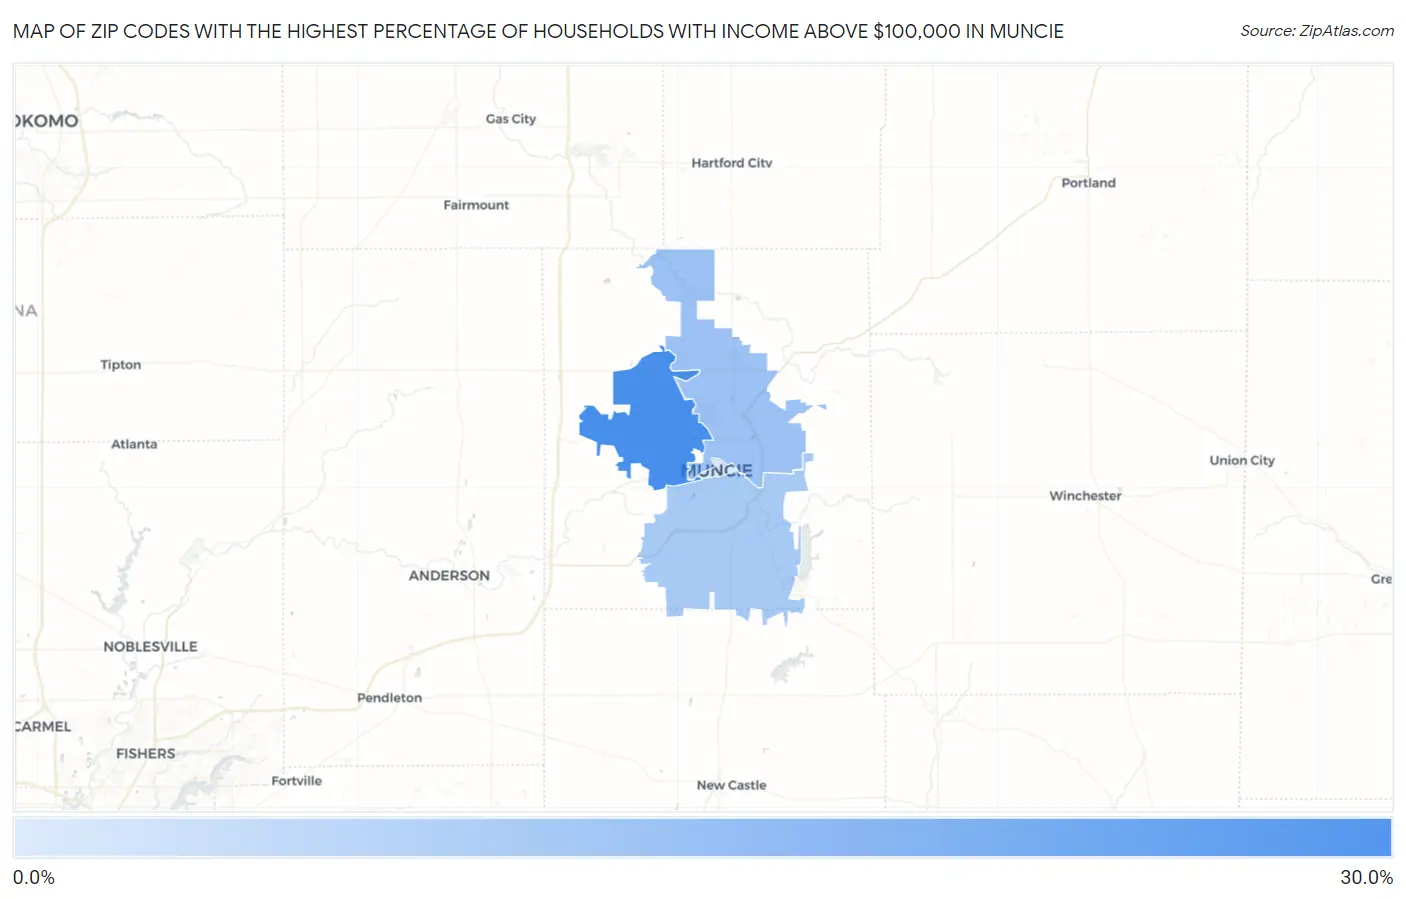
Map of Zip Codes with the Highest Percentage of Households with Income Above $100,000 in Muncie
5.9%
27.9%
Zip Codes with the Highest Percentage of Households with Income Above $100,000 in Muncie, IN
| Zip Code | Households with Income > $100k | vs State | vs National | |
| 1. | 47304 | 27.9% | 30.7%(-2.80)#385 | 37.3%(-9.40)#17,202 |
| 2. | 47303 | 15.0% | 30.7%(-15.7)#667 | 37.3%(-22.3)#27,530 |
| 3. | 47302 | 13.3% | 30.7%(-17.4)#690 | 37.3%(-24.0)#28,437 |
| 4. | 47305 | 5.9% | 30.7%(-24.8)#743 | 37.3%(-31.4)#30,877 |
1
Common Questions
What are the Top 3 Zip Codes with the Highest Percentage of Households with Income Above $100,000 in Muncie, IN?
Top 3 Zip Codes with the Highest Percentage of Households with Income Above $100,000 in Muncie, IN are:
What zip code has the Highest Percentage of Households with Income Above $100,000 in Muncie, IN?
47304 has the Highest Percentage of Households with Income Above $100,000 in Muncie, IN with 27.9%.
What is the Percentage of Households with Income Above $100,000 in Muncie, IN?
Percentage of Households with Income Above $100,000 in Muncie is 13.6%.
What is the Percentage of Households with Income Above $100,000 in Indiana?
Percentage of Households with Income Above $100,000 in Indiana is 30.7%.
What is the Percentage of Households with Income Above $100,000 in the United States?
Percentage of Households with Income Above $100,000 in the United States is 37.3%.