Zip Codes with the Highest Percentage of Population Employed in Administrative & Support Services in Muncie, IN
RELATED REPORTS & OPTIONS
Administrative & Support Services
Muncie
Compare Zip Codes
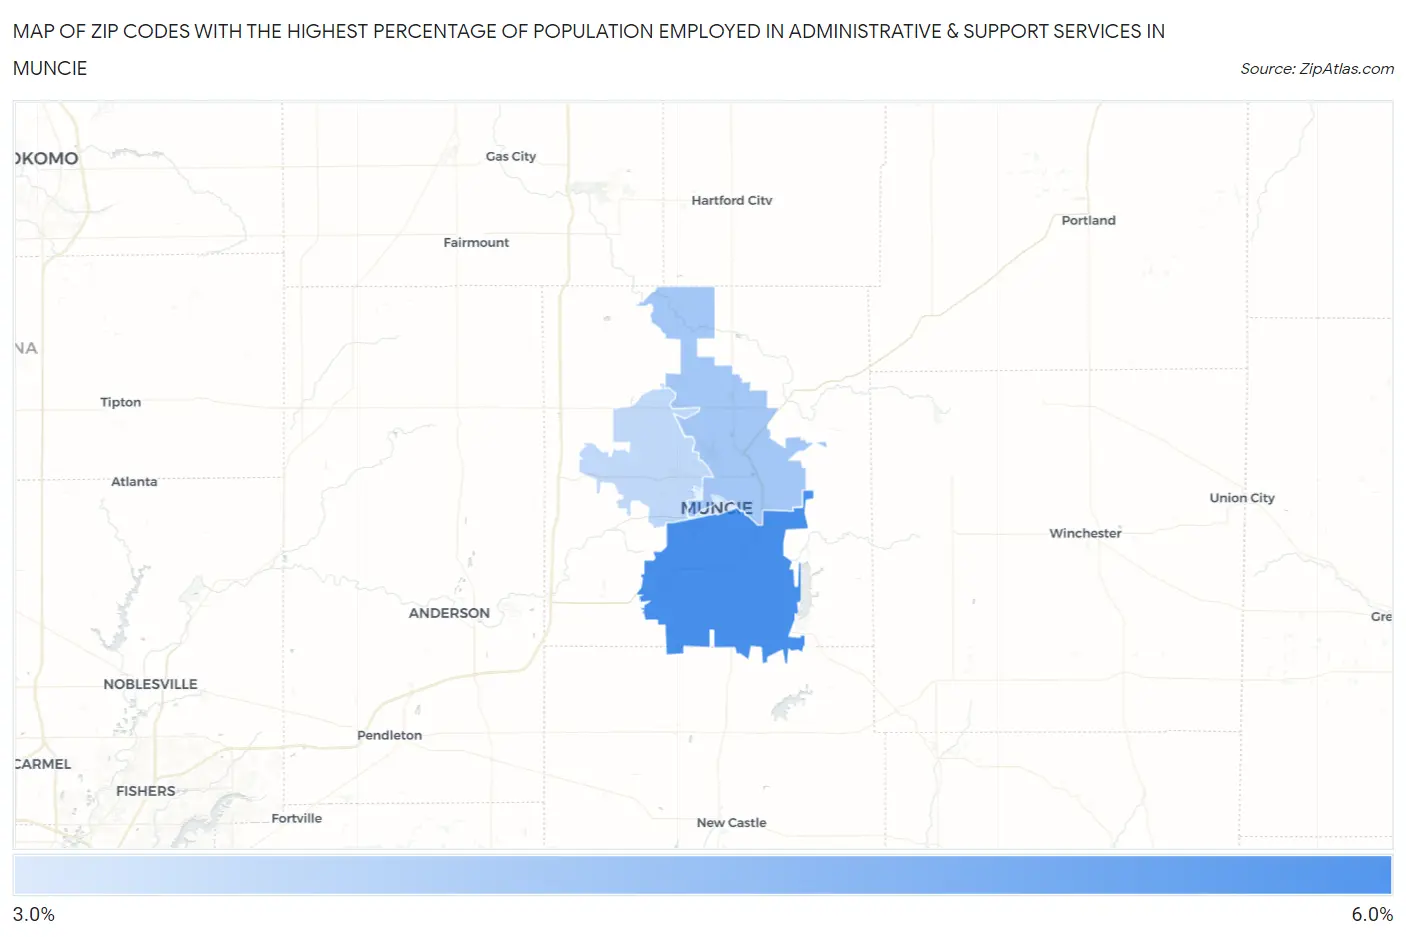
Map of Zip Codes with the Highest Percentage of Population Employed in Administrative & Support Services in Muncie
3.5%
5.4%
Zip Codes with the Highest Percentage of Population Employed in Administrative & Support Services in Muncie, IN
| Zip Code | % Employed | vs State | vs National | |
| 1. | 47302 | 5.4% | 3.5%(+1.88)#118 | 4.1%(+1.26)#6,048 |
| 2. | 47303 | 4.2% | 3.5%(+0.687)#215 | 4.1%(+0.066)#9,765 |
| 3. | 47304 | 3.8% | 3.5%(+0.317)#247 | 4.1%(-0.303)#11,332 |
| 4. | 47305 | 3.5% | 3.5%(-0.065)#299 | 4.1%(-0.686)#13,148 |
1
Common Questions
What are the Top 3 Zip Codes with the Highest Percentage of Population Employed in Administrative & Support Services in Muncie, IN?
Top 3 Zip Codes with the Highest Percentage of Population Employed in Administrative & Support Services in Muncie, IN are:
What zip code has the Highest Percentage of Population Employed in Administrative & Support Services in Muncie, IN?
47302 has the Highest Percentage of Population Employed in Administrative & Support Services in Muncie, IN with 5.4%.
What is the Percentage of Population Employed in Administrative & Support Services in Muncie, IN?
Percentage of Population Employed in Administrative & Support Services in Muncie is 4.4%.
What is the Percentage of Population Employed in Administrative & Support Services in Indiana?
Percentage of Population Employed in Administrative & Support Services in Indiana is 3.5%.
What is the Percentage of Population Employed in Administrative & Support Services in the United States?
Percentage of Population Employed in Administrative & Support Services in the United States is 4.1%.