Zip Codes with the Highest Percentage of Population Employed in Transportation & Warehousing in Muncie, IN
RELATED REPORTS & OPTIONS
Transportation & Warehousing
Muncie
Compare Zip Codes
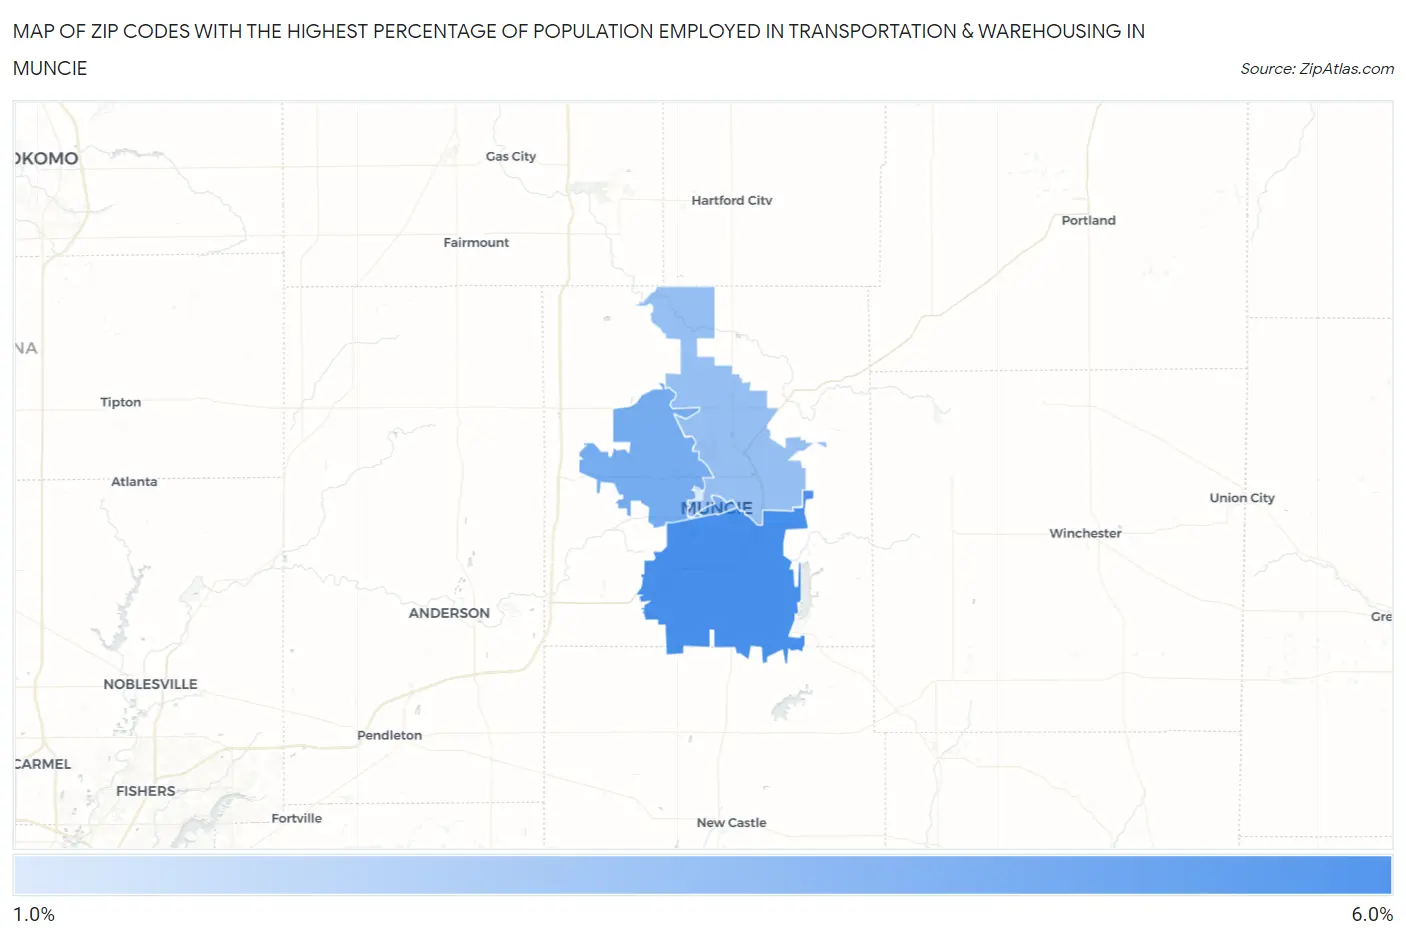
Map of Zip Codes with the Highest Percentage of Population Employed in Transportation & Warehousing in Muncie
1.2%
5.2%
Zip Codes with the Highest Percentage of Population Employed in Transportation & Warehousing in Muncie, IN
| Zip Code | % Employed | vs State | vs National | |
| 1. | 47302 | 5.2% | 5.1%(+0.039)#288 | 4.9%(+0.235)#11,308 |
| 2. | 47304 | 4.0% | 5.1%(-1.19)#417 | 4.9%(-0.993)#16,112 |
| 3. | 47305 | 3.7% | 5.1%(-1.45)#437 | 4.9%(-1.25)#17,247 |
| 4. | 47303 | 3.1% | 5.1%(-2.05)#504 | 4.9%(-1.85)#19,833 |
| 5. | 47306 | 1.2% | 5.1%(-3.91)#656 | 4.9%(-3.72)#26,522 |
1
Common Questions
What are the Top 3 Zip Codes with the Highest Percentage of Population Employed in Transportation & Warehousing in Muncie, IN?
Top 3 Zip Codes with the Highest Percentage of Population Employed in Transportation & Warehousing in Muncie, IN are:
What zip code has the Highest Percentage of Population Employed in Transportation & Warehousing in Muncie, IN?
47302 has the Highest Percentage of Population Employed in Transportation & Warehousing in Muncie, IN with 5.2%.
What is the Percentage of Population Employed in Transportation & Warehousing in Muncie, IN?
Percentage of Population Employed in Transportation & Warehousing in Muncie is 3.6%.
What is the Percentage of Population Employed in Transportation & Warehousing in Indiana?
Percentage of Population Employed in Transportation & Warehousing in Indiana is 5.1%.
What is the Percentage of Population Employed in Transportation & Warehousing in the United States?
Percentage of Population Employed in Transportation & Warehousing in the United States is 4.9%.