Zip Codes with the Highest Percentage of Population with a Degree in Visual and Performing Arts in Muncie, IN
RELATED REPORTS & OPTIONS
Visual and Performing Arts
Muncie
Compare Zip Codes
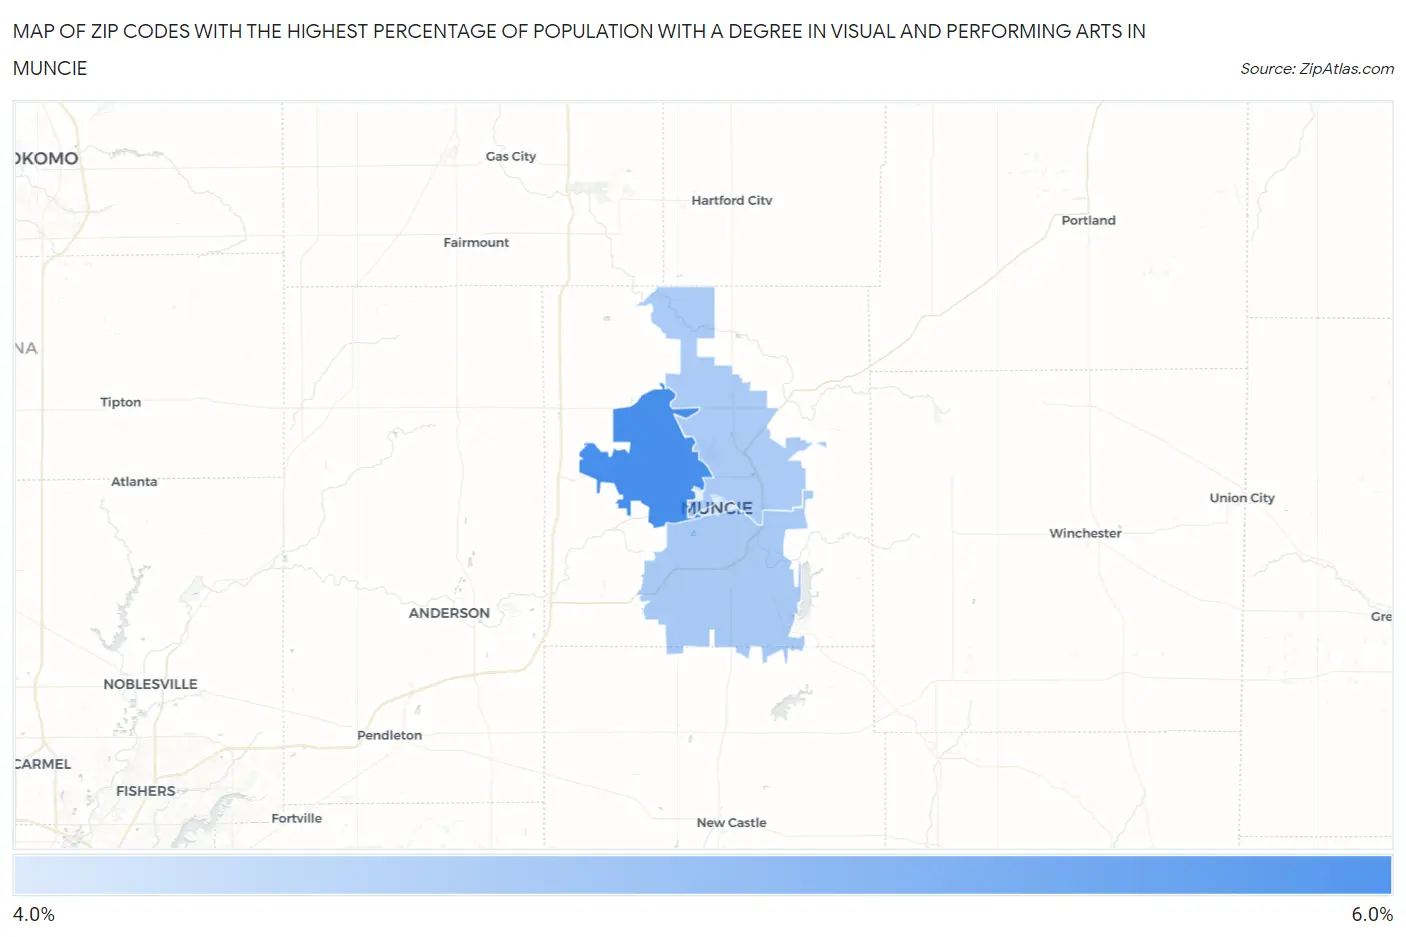
Map of Zip Codes with the Highest Percentage of Population with a Degree in Visual and Performing Arts in Muncie
4.1%
5.4%
Zip Codes with the Highest Percentage of Population with a Degree in Visual and Performing Arts in Muncie, IN
| Zip Code | % Graduates | vs State | vs National | |
| 1. | 47304 | 5.4% | 3.2%(+2.13)#107 | 4.3%(+1.13)#5,891 |
| 2. | 47302 | 4.5% | 3.2%(+1.30)#145 | 4.3%(+0.293)#7,671 |
| 3. | 47303 | 4.5% | 3.2%(+1.28)#146 | 4.3%(+0.278)#7,733 |
| 4. | 47305 | 4.1% | 3.2%(+0.858)#173 | 4.3%(-0.148)#8,929 |
1
Common Questions
What are the Top 3 Zip Codes with the Highest Percentage of Population with a Degree in Visual and Performing Arts in Muncie, IN?
Top 3 Zip Codes with the Highest Percentage of Population with a Degree in Visual and Performing Arts in Muncie, IN are:
What zip code has the Highest Percentage of Population with a Degree in Visual and Performing Arts in Muncie, IN?
47304 has the Highest Percentage of Population with a Degree in Visual and Performing Arts in Muncie, IN with 5.4%.
What is the Percentage of Population with a Degree in Visual and Performing Arts in Muncie, IN?
Percentage of Population with a Degree in Visual and Performing Arts in Muncie is 6.8%.
What is the Percentage of Population with a Degree in Visual and Performing Arts in Indiana?
Percentage of Population with a Degree in Visual and Performing Arts in Indiana is 3.2%.
What is the Percentage of Population with a Degree in Visual and Performing Arts in the United States?
Percentage of Population with a Degree in Visual and Performing Arts in the United States is 4.3%.