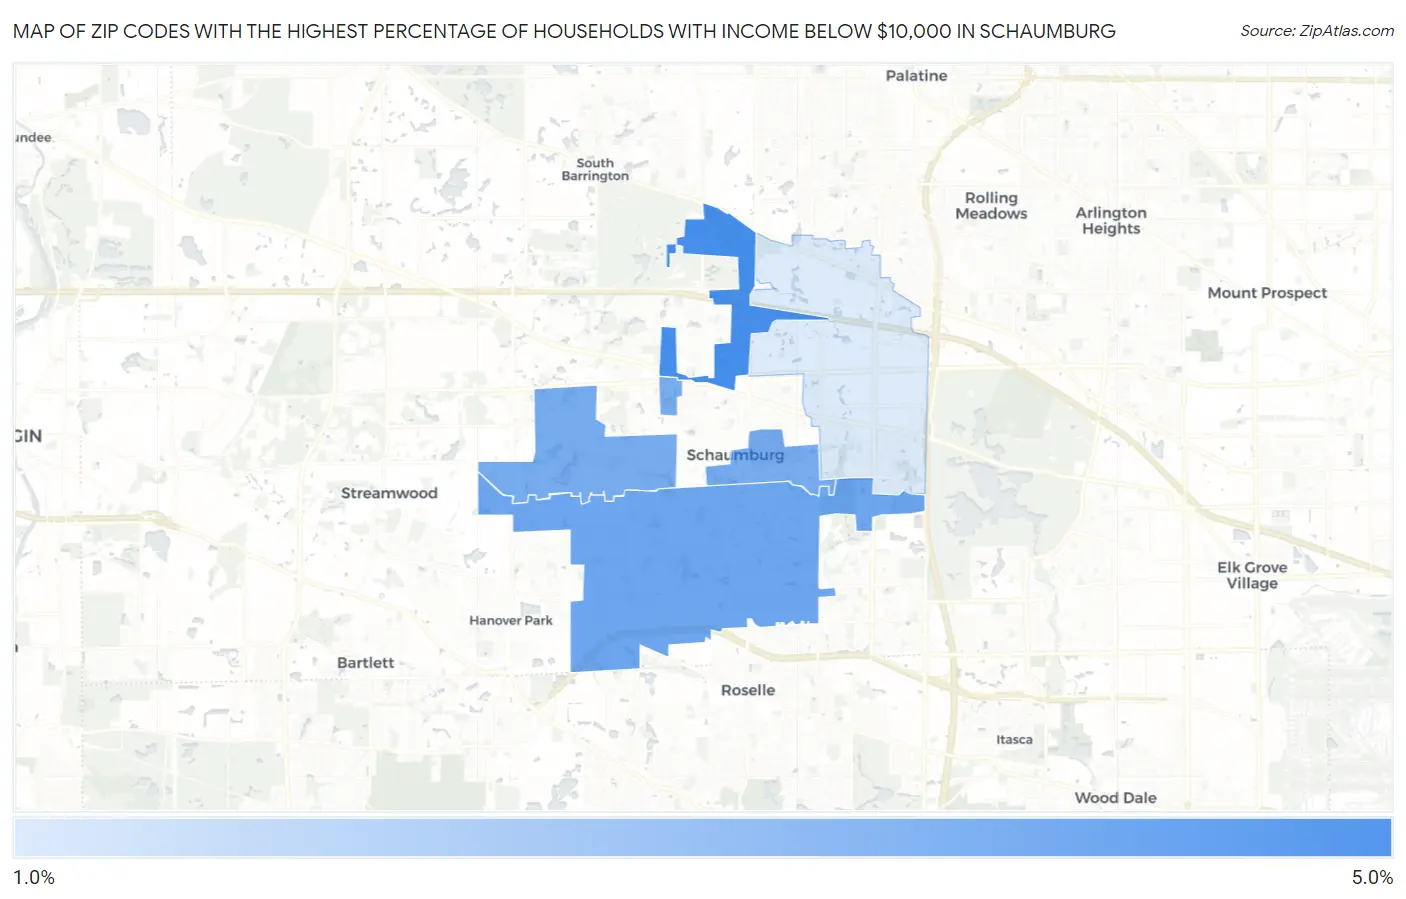
Zip Codes with the Highest Percentage of Households with Income Below $10,000 in Schaumburg, IL
RELATED REPORTS & OPTIONS
Household Income | $0-10k
Schaumburg
Compare Zip Codes
Map of Zip Codes with the Highest Percentage of Households with Income Below $10,000 in Schaumburg
1.5%
4.9%
Zip Codes with the Highest Percentage of Households with Income Below $10,000 in Schaumburg, IL
| Zip Code | Households with Income < $10k | vs State | vs National | |
| 1. | 60195 | 4.9% | 5.3%(-0.400)#472 | 4.9%(=0.000)#12,132 |
| 2. | 60193 | 4.0% | 5.3%(-1.30)#618 | 4.9%(-0.900)#15,222 |
| 3. | 60194 | 3.8% | 5.3%(-1.50)#658 | 4.9%(-1.10)#16,069 |
| 4. | 60173 | 1.5% | 5.3%(-3.80)#1,084 | 4.9%(-3.40)#25,462 |
1
Common Questions
What are the Top 3 Zip Codes with the Highest Percentage of Households with Income Below $10,000 in Schaumburg, IL?
Top 3 Zip Codes with the Highest Percentage of Households with Income Below $10,000 in Schaumburg, IL are:
What zip code has the Highest Percentage of Households with Income Below $10,000 in Schaumburg, IL?
60195 has the Highest Percentage of Households with Income Below $10,000 in Schaumburg, IL with 4.9%.
What is the Percentage of Households with Income Below $10,000 in Schaumburg, IL?
Percentage of Households with Income Below $10,000 in Schaumburg is 3.5%.
What is the Percentage of Households with Income Below $10,000 in Illinois?
Percentage of Households with Income Below $10,000 in Illinois is 5.3%.
What is the Percentage of Households with Income Below $10,000 in the United States?
Percentage of Households with Income Below $10,000 in the United States is 4.9%.