Zip Codes with the Highest Percentage of Households with Income Below $10,000 in East Saint Louis, IL
RELATED REPORTS & OPTIONS
Household Income | $0-10k
East Saint Louis
Compare Zip Codes
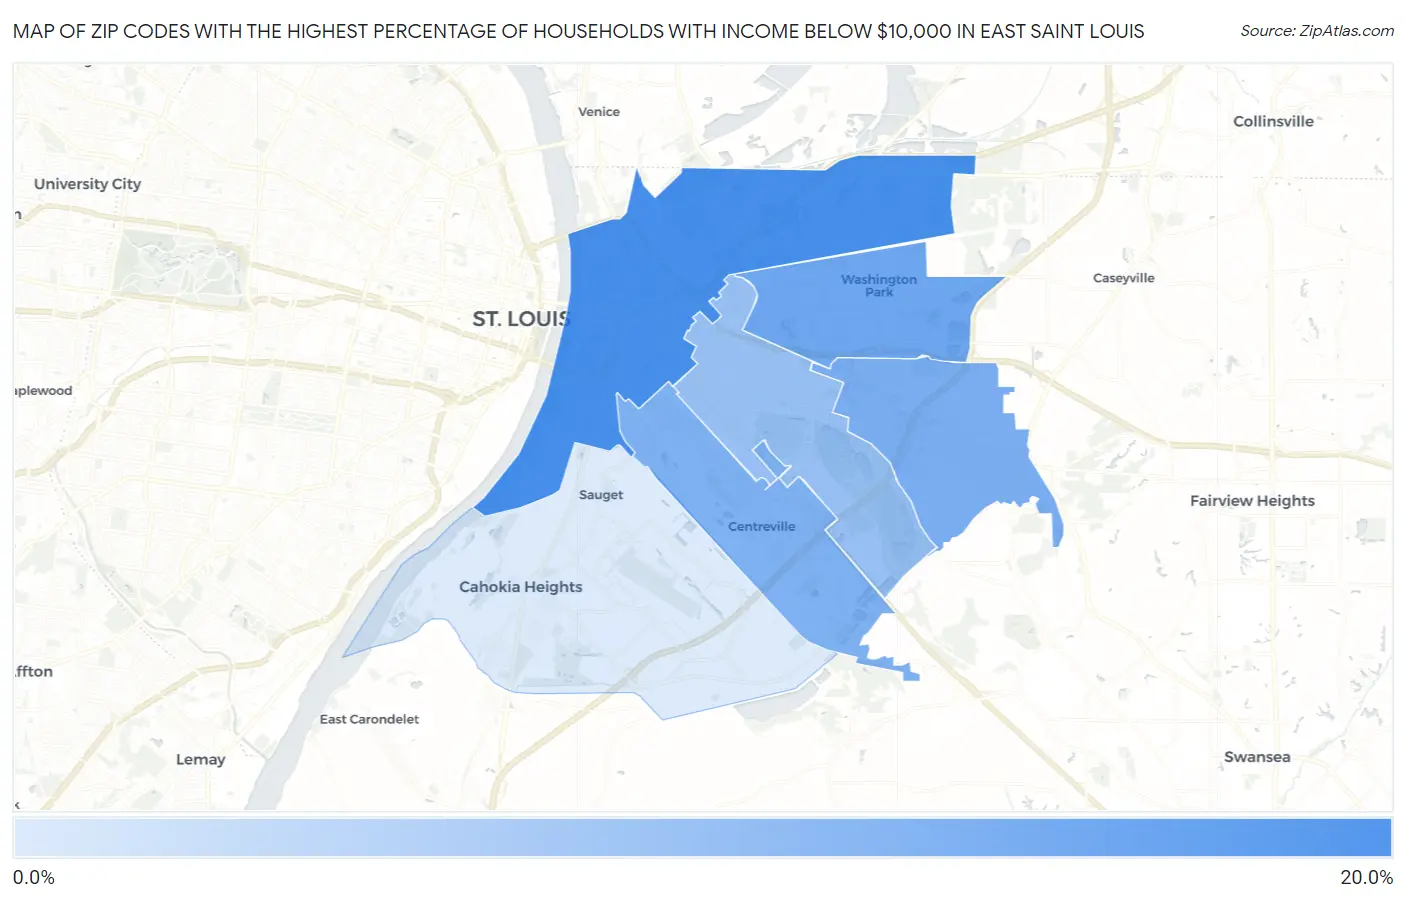
Map of Zip Codes with the Highest Percentage of Households with Income Below $10,000 in East Saint Louis
6.1%
19.4%
Zip Codes with the Highest Percentage of Households with Income Below $10,000 in East Saint Louis, IL
| Zip Code | Households with Income < $10k | vs State | vs National | |
| 1. | 62201 | 19.4% | 5.3%(+14.1)#15 | 4.9%(+14.5)#853 |
| 2. | 62204 | 15.8% | 5.3%(+10.5)#28 | 4.9%(+10.9)#1,377 |
| 3. | 62203 | 14.8% | 5.3%(+9.50)#31 | 4.9%(+9.90)#1,569 |
| 4. | 62207 | 14.3% | 5.3%(+9.00)#37 | 4.9%(+9.40)#1,691 |
| 5. | 62205 | 12.1% | 5.3%(+6.80)#68 | 4.9%(+7.20)#2,418 |
| 6. | 62206 | 6.1% | 5.3%(+0.800)#323 | 4.9%(+1.20)#8,809 |
1
Common Questions
What are the Top 5 Zip Codes with the Highest Percentage of Households with Income Below $10,000 in East Saint Louis, IL?
Top 5 Zip Codes with the Highest Percentage of Households with Income Below $10,000 in East Saint Louis, IL are:
What zip code has the Highest Percentage of Households with Income Below $10,000 in East Saint Louis, IL?
62201 has the Highest Percentage of Households with Income Below $10,000 in East Saint Louis, IL with 19.4%.
What is the Percentage of Households with Income Below $10,000 in Illinois?
Percentage of Households with Income Below $10,000 in Illinois is 5.3%.
What is the Percentage of Households with Income Below $10,000 in the United States?
Percentage of Households with Income Below $10,000 in the United States is 4.9%.