Zip Codes with the Highest Percentage of Population Employed in Food Preparation & Serving in Jacksonville, FL
RELATED REPORTS & OPTIONS
Food Preparation & Serving
Jacksonville
Compare Zip Codes
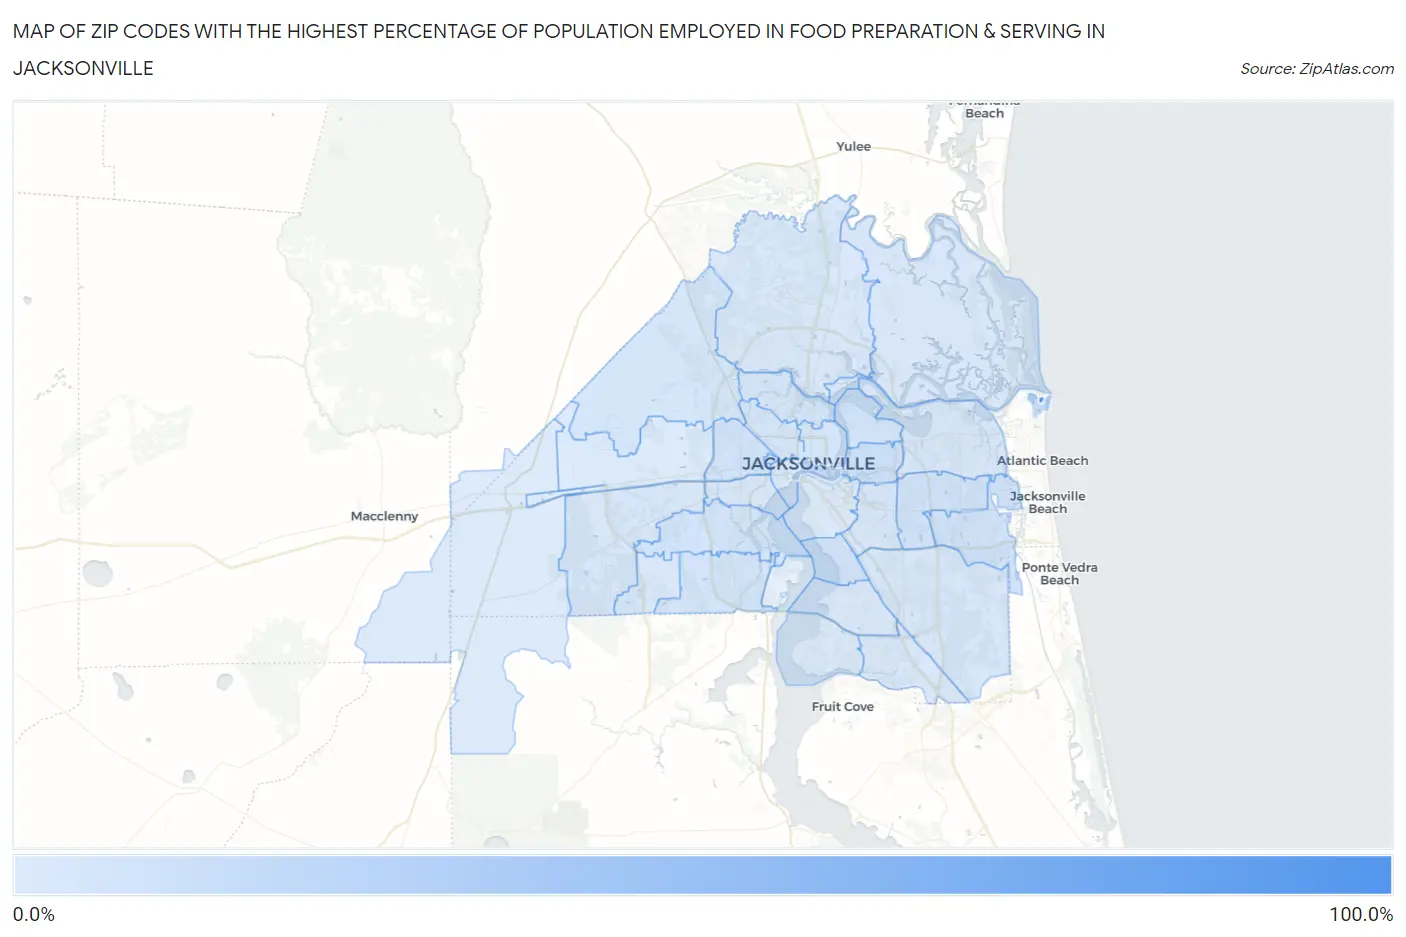
Map of Zip Codes with the Highest Percentage of Population Employed in Food Preparation & Serving in Jacksonville
3.3%
100.0%
Zip Codes with the Highest Percentage of Population Employed in Food Preparation & Serving in Jacksonville, FL
| Zip Code | % Employed | vs State | vs National | |
| 1. | 32228 | 100.0% | 6.1%(+93.9)#2 | 5.3%(+94.7)#4 |
| 2. | 32202 | 19.1% | 6.1%(+13.0)#8 | 5.3%(+13.8)#559 |
| 3. | 32227 | 16.4% | 6.1%(+10.3)#16 | 5.3%(+11.1)#814 |
| 4. | 32211 | 9.7% | 6.1%(+3.64)#101 | 5.3%(+4.44)#2,860 |
| 5. | 32224 | 9.1% | 6.1%(+2.98)#136 | 5.3%(+3.78)#3,457 |
| 6. | 32246 | 8.6% | 6.1%(+2.56)#153 | 5.3%(+3.36)#3,914 |
| 7. | 32217 | 8.6% | 6.1%(+2.55)#155 | 5.3%(+3.35)#3,919 |
| 8. | 32254 | 8.4% | 6.1%(+2.30)#169 | 5.3%(+3.10)#4,191 |
| 9. | 32277 | 8.0% | 6.1%(+1.91)#194 | 5.3%(+2.71)#4,733 |
| 10. | 32210 | 7.8% | 6.1%(+1.68)#222 | 5.3%(+2.48)#5,113 |
| 11. | 32244 | 7.6% | 6.1%(+1.48)#249 | 5.3%(+2.29)#5,423 |
| 12. | 32206 | 6.9% | 6.1%(+0.814)#328 | 5.3%(+1.62)#6,802 |
| 13. | 32209 | 6.9% | 6.1%(+0.764)#333 | 5.3%(+1.57)#6,926 |
| 14. | 32208 | 6.1% | 6.1%(+0.008)#442 | 5.3%(+0.813)#9,027 |
| 15. | 32219 | 6.0% | 6.1%(-0.065)#453 | 5.3%(+0.740)#9,257 |
| 16. | 32205 | 6.0% | 6.1%(-0.125)#466 | 5.3%(+0.679)#9,456 |
| 17. | 32204 | 5.9% | 6.1%(-0.226)#481 | 5.3%(+0.579)#9,800 |
| 18. | 32256 | 5.9% | 6.1%(-0.227)#482 | 5.3%(+0.578)#9,803 |
| 19. | 32226 | 5.7% | 6.1%(-0.344)#497 | 5.3%(+0.460)#10,194 |
| 20. | 32216 | 5.5% | 6.1%(-0.551)#526 | 5.3%(+0.254)#10,924 |
| 21. | 32221 | 5.4% | 6.1%(-0.682)#544 | 5.3%(+0.122)#11,374 |
| 22. | 32225 | 5.2% | 6.1%(-0.859)#563 | 5.3%(-0.055)#12,015 |
| 23. | 32257 | 4.6% | 6.1%(-1.45)#648 | 5.3%(-0.645)#14,405 |
| 24. | 32258 | 4.6% | 6.1%(-1.48)#652 | 5.3%(-0.675)#14,548 |
| 25. | 32222 | 4.6% | 6.1%(-1.49)#655 | 5.3%(-0.689)#14,613 |
| 26. | 32218 | 4.2% | 6.1%(-1.89)#698 | 5.3%(-1.09)#16,320 |
| 27. | 32234 | 3.8% | 6.1%(-2.28)#751 | 5.3%(-1.47)#17,878 |
| 28. | 32207 | 3.8% | 6.1%(-2.32)#757 | 5.3%(-1.51)#18,040 |
| 29. | 32223 | 3.5% | 6.1%(-2.64)#789 | 5.3%(-1.83)#19,389 |
| 30. | 32220 | 3.3% | 6.1%(-2.75)#797 | 5.3%(-1.94)#19,873 |
1
Common Questions
What are the Top 10 Zip Codes with the Highest Percentage of Population Employed in Food Preparation & Serving in Jacksonville, FL?
Top 10 Zip Codes with the Highest Percentage of Population Employed in Food Preparation & Serving in Jacksonville, FL are:
What zip code has the Highest Percentage of Population Employed in Food Preparation & Serving in Jacksonville, FL?
32228 has the Highest Percentage of Population Employed in Food Preparation & Serving in Jacksonville, FL with 100.0%.
What is the Percentage of Population Employed in Food Preparation & Serving in Jacksonville, FL?
Percentage of Population Employed in Food Preparation & Serving in Jacksonville is 6.4%.
What is the Percentage of Population Employed in Food Preparation & Serving in Florida?
Percentage of Population Employed in Food Preparation & Serving in Florida is 6.1%.
What is the Percentage of Population Employed in Food Preparation & Serving in the United States?
Percentage of Population Employed in Food Preparation & Serving in the United States is 5.3%.