Zip Codes with the Highest Percentage of Population Employed in Food Preparation & Serving in Davenport, FL
RELATED REPORTS & OPTIONS
Food Preparation & Serving
Davenport
Compare Zip Codes
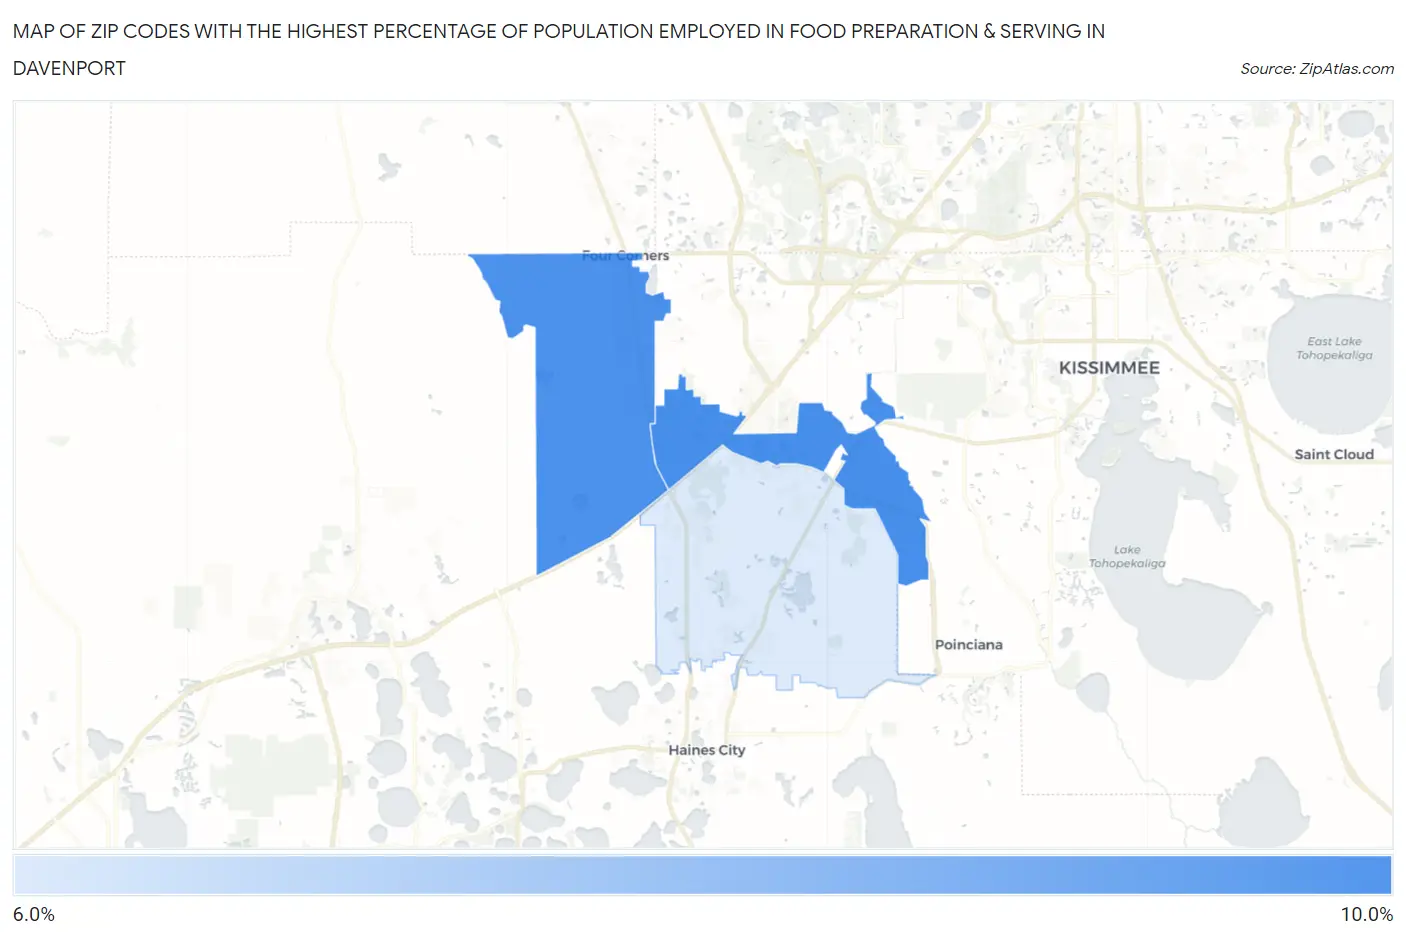
Map of Zip Codes with the Highest Percentage of Population Employed in Food Preparation & Serving in Davenport
6.2%
9.3%
Zip Codes with the Highest Percentage of Population Employed in Food Preparation & Serving in Davenport, FL
| Zip Code | % Employed | vs State | vs National | |
| 1. | 33896 | 9.3% | 6.1%(+3.20)#123 | 5.3%(+4.01)#3,241 |
| 2. | 33897 | 9.2% | 6.1%(+3.10)#133 | 5.3%(+3.91)#3,331 |
| 3. | 33837 | 6.2% | 6.1%(+0.108)#425 | 5.3%(+0.913)#8,731 |
1
Common Questions
What are the Top Zip Codes with the Highest Percentage of Population Employed in Food Preparation & Serving in Davenport, FL?
Top Zip Codes with the Highest Percentage of Population Employed in Food Preparation & Serving in Davenport, FL are:
What zip code has the Highest Percentage of Population Employed in Food Preparation & Serving in Davenport, FL?
33896 has the Highest Percentage of Population Employed in Food Preparation & Serving in Davenport, FL with 9.3%.
What is the Percentage of Population Employed in Food Preparation & Serving in Davenport, FL?
Percentage of Population Employed in Food Preparation & Serving in Davenport is 2.8%.
What is the Percentage of Population Employed in Food Preparation & Serving in Florida?
Percentage of Population Employed in Food Preparation & Serving in Florida is 6.1%.
What is the Percentage of Population Employed in Food Preparation & Serving in the United States?
Percentage of Population Employed in Food Preparation & Serving in the United States is 5.3%.