Zip Codes with the Highest Percentage of Population Employed in Food Preparation & Serving in Punta Gorda, FL
RELATED REPORTS & OPTIONS
Food Preparation & Serving
Punta Gorda
Compare Zip Codes
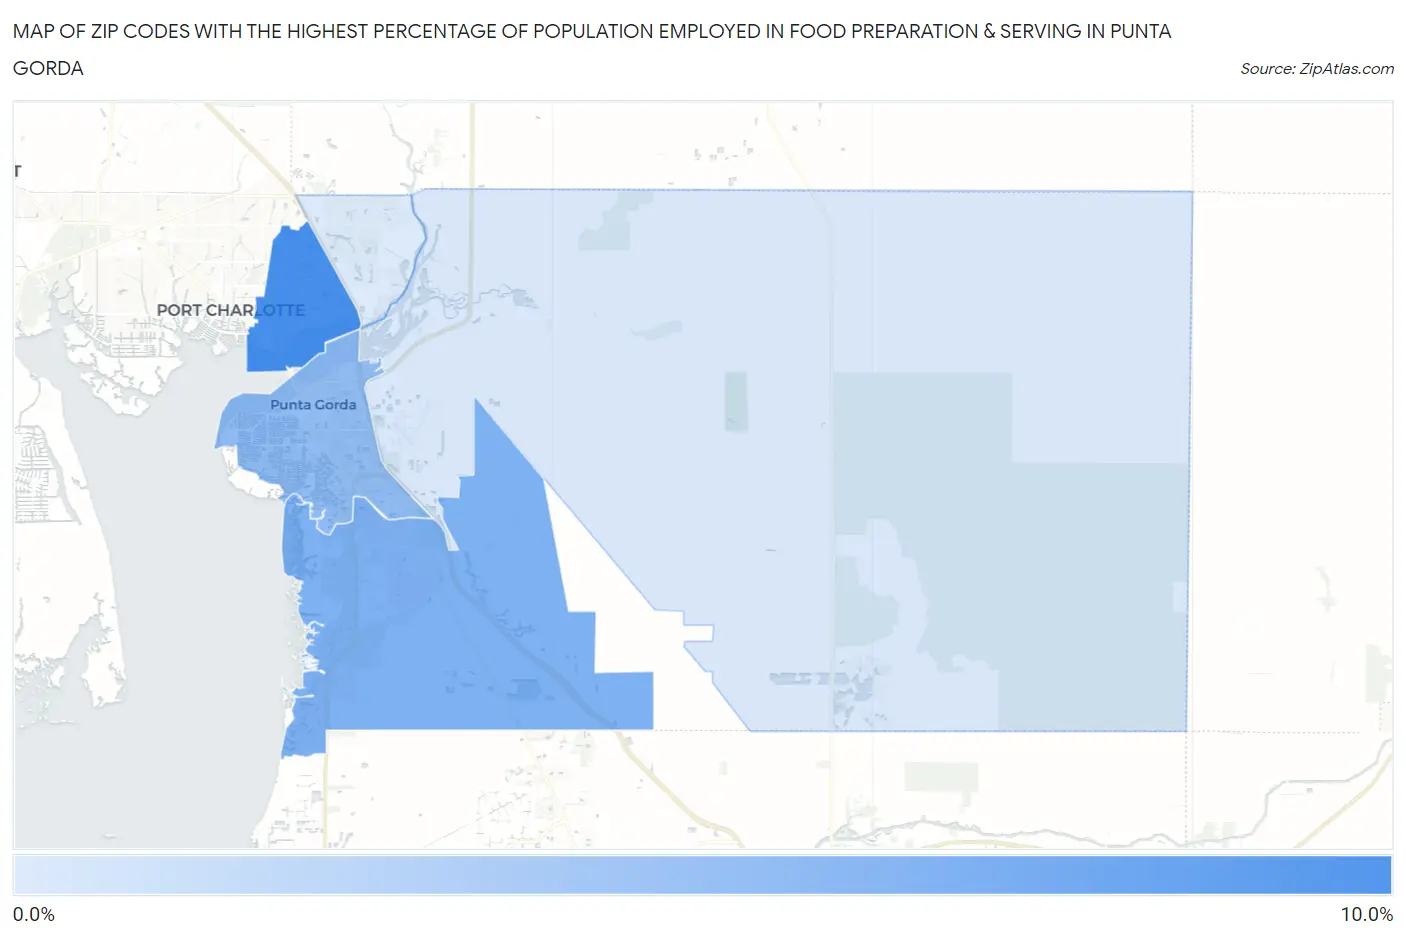
Map of Zip Codes with the Highest Percentage of Population Employed in Food Preparation & Serving in Punta Gorda
1.8%
8.0%
Zip Codes with the Highest Percentage of Population Employed in Food Preparation & Serving in Punta Gorda, FL
| Zip Code | % Employed | vs State | vs National | |
| 1. | 33980 | 8.0% | 6.1%(+1.95)#192 | 5.3%(+2.75)#4,669 |
| 2. | 33955 | 5.6% | 6.1%(-0.441)#509 | 5.3%(+0.364)#10,519 |
| 3. | 33950 | 5.0% | 6.1%(-1.14)#606 | 5.3%(-0.334)#13,138 |
| 4. | 33982 | 2.0% | 6.1%(-4.08)#893 | 5.3%(-3.28)#24,672 |
| 5. | 33983 | 1.8% | 6.1%(-4.29)#897 | 5.3%(-3.49)#25,262 |
1
Common Questions
What are the Top 3 Zip Codes with the Highest Percentage of Population Employed in Food Preparation & Serving in Punta Gorda, FL?
Top 3 Zip Codes with the Highest Percentage of Population Employed in Food Preparation & Serving in Punta Gorda, FL are:
What zip code has the Highest Percentage of Population Employed in Food Preparation & Serving in Punta Gorda, FL?
33980 has the Highest Percentage of Population Employed in Food Preparation & Serving in Punta Gorda, FL with 8.0%.
What is the Percentage of Population Employed in Food Preparation & Serving in Punta Gorda, FL?
Percentage of Population Employed in Food Preparation & Serving in Punta Gorda is 5.2%.
What is the Percentage of Population Employed in Food Preparation & Serving in Florida?
Percentage of Population Employed in Food Preparation & Serving in Florida is 6.1%.
What is the Percentage of Population Employed in Food Preparation & Serving in the United States?
Percentage of Population Employed in Food Preparation & Serving in the United States is 5.3%.