Zip Codes with the Highest Percentage of Population Employed in Food Preparation & Serving in Fort Walton Beach, FL
RELATED REPORTS & OPTIONS
Food Preparation & Serving
Fort Walton Beach
Compare Zip Codes
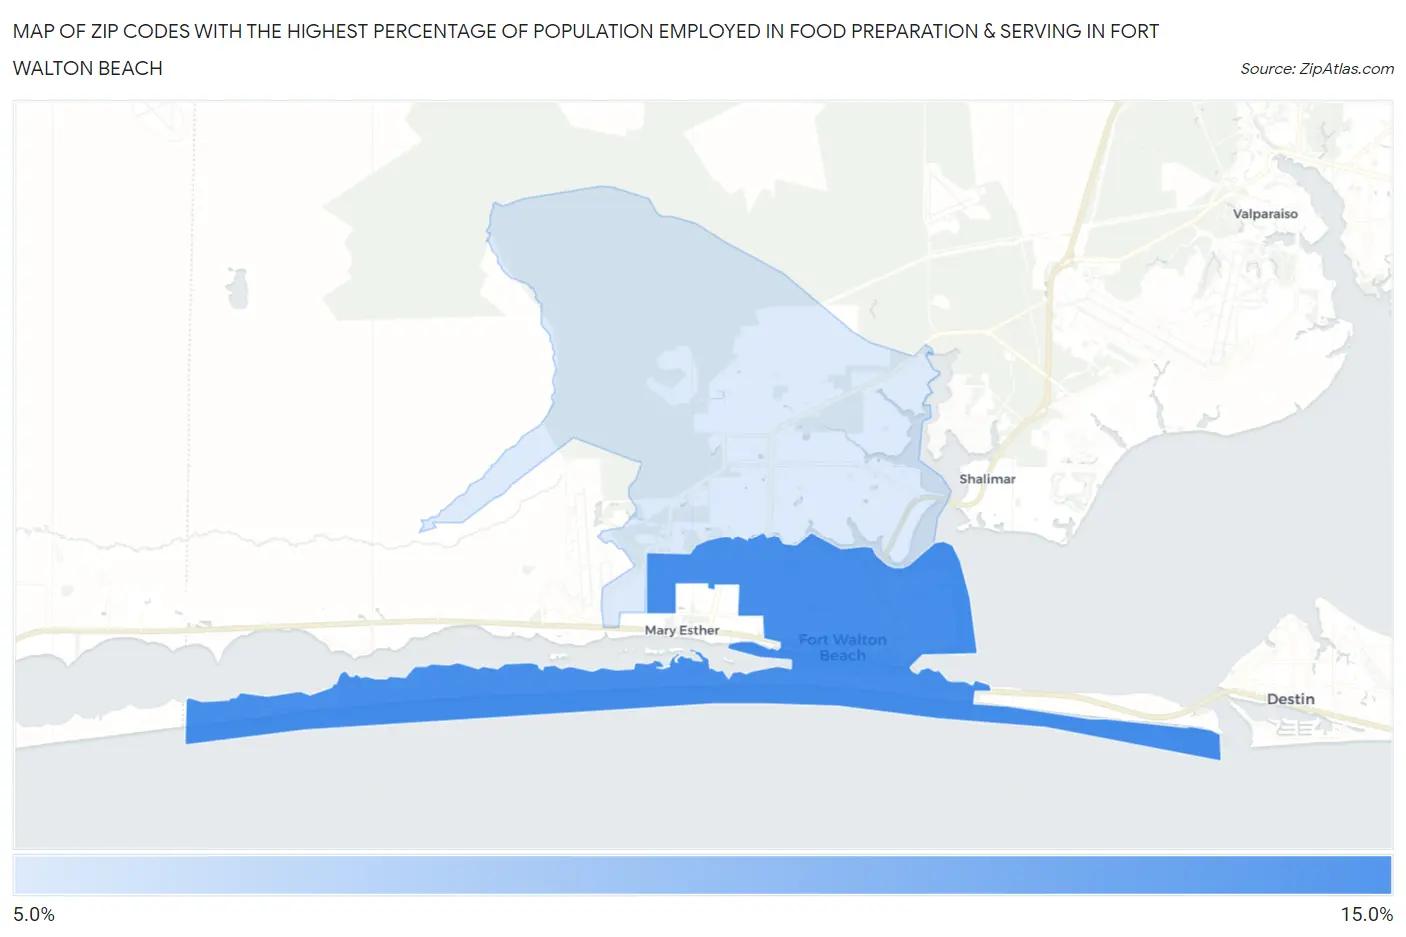
Map of Zip Codes with the Highest Percentage of Population Employed in Food Preparation & Serving in Fort Walton Beach
7.0%
12.6%
Zip Codes with the Highest Percentage of Population Employed in Food Preparation & Serving in Fort Walton Beach, FL
| Zip Code | % Employed | vs State | vs National | |
| 1. | 32548 | 12.6% | 6.1%(+6.49)#41 | 5.3%(+7.29)#1,499 |
| 2. | 32547 | 7.0% | 6.1%(+0.936)#310 | 5.3%(+1.74)#6,496 |
1
Common Questions
What are the Top Zip Codes with the Highest Percentage of Population Employed in Food Preparation & Serving in Fort Walton Beach, FL?
Top Zip Codes with the Highest Percentage of Population Employed in Food Preparation & Serving in Fort Walton Beach, FL are:
What zip code has the Highest Percentage of Population Employed in Food Preparation & Serving in Fort Walton Beach, FL?
32548 has the Highest Percentage of Population Employed in Food Preparation & Serving in Fort Walton Beach, FL with 12.6%.
What is the Percentage of Population Employed in Food Preparation & Serving in Fort Walton Beach, FL?
Percentage of Population Employed in Food Preparation & Serving in Fort Walton Beach is 12.1%.
What is the Percentage of Population Employed in Food Preparation & Serving in Florida?
Percentage of Population Employed in Food Preparation & Serving in Florida is 6.1%.
What is the Percentage of Population Employed in Food Preparation & Serving in the United States?
Percentage of Population Employed in Food Preparation & Serving in the United States is 5.3%.