Zip Codes with the Highest Percentage of Population Employed in Food Preparation & Serving in Seminole, FL
RELATED REPORTS & OPTIONS
Food Preparation & Serving
Seminole
Compare Zip Codes
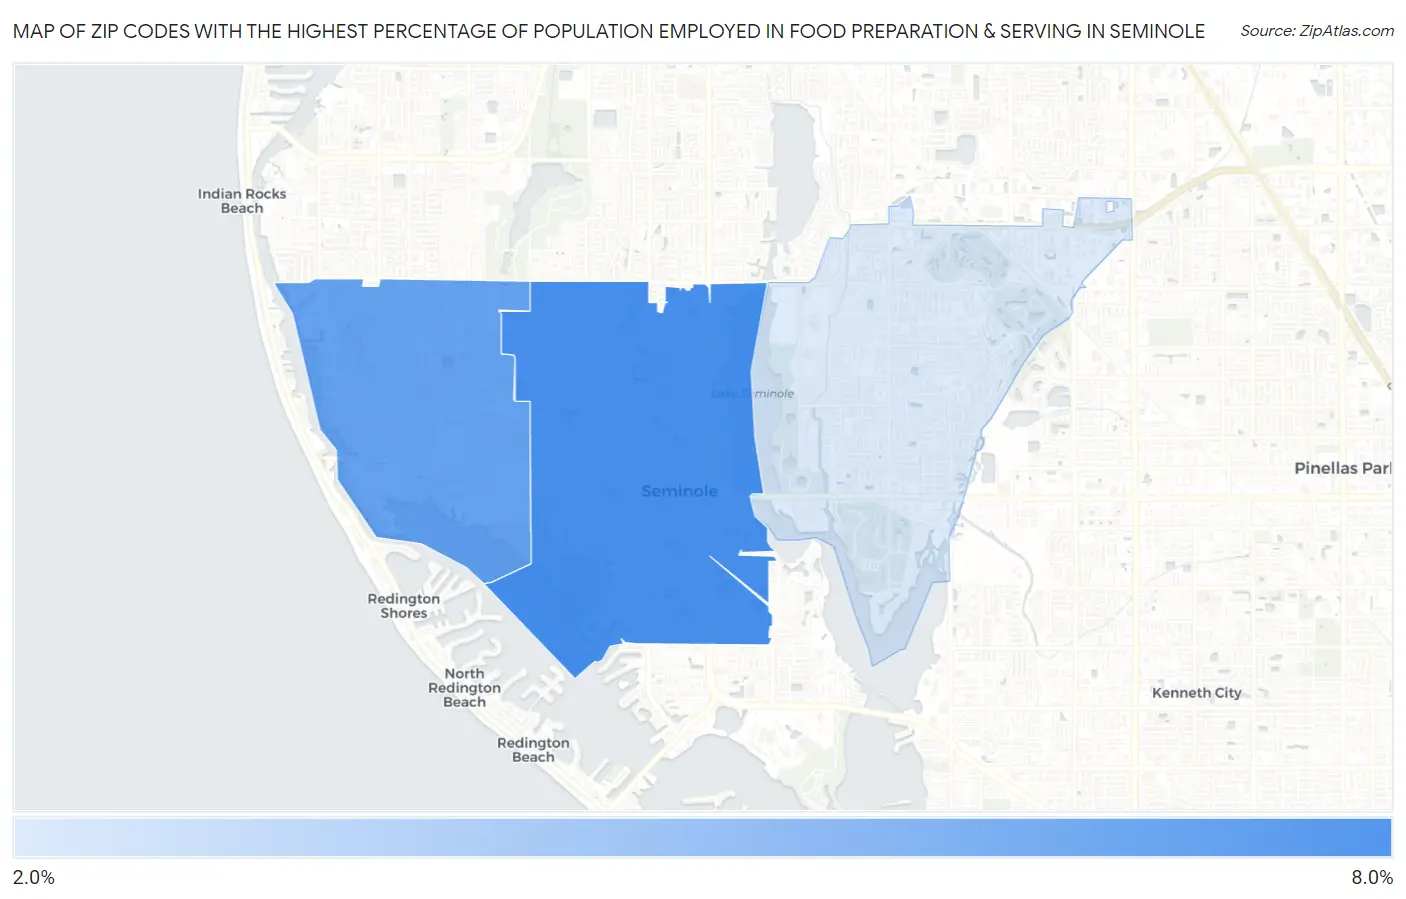
Map of Zip Codes with the Highest Percentage of Population Employed in Food Preparation & Serving in Seminole
2.7%
7.0%
Zip Codes with the Highest Percentage of Population Employed in Food Preparation & Serving in Seminole, FL
| Zip Code | % Employed | vs State | vs National | |
| 1. | 33772 | 7.0% | 6.1%(+0.906)#317 | 5.3%(+1.71)#6,570 |
| 2. | 33776 | 6.1% | 6.1%(+0.029)#437 | 5.3%(+0.833)#8,965 |
| 3. | 33777 | 2.7% | 6.1%(-3.43)#846 | 5.3%(-2.62)#22,556 |
1
Common Questions
What are the Top Zip Codes with the Highest Percentage of Population Employed in Food Preparation & Serving in Seminole, FL?
Top Zip Codes with the Highest Percentage of Population Employed in Food Preparation & Serving in Seminole, FL are:
What zip code has the Highest Percentage of Population Employed in Food Preparation & Serving in Seminole, FL?
33772 has the Highest Percentage of Population Employed in Food Preparation & Serving in Seminole, FL with 7.0%.
What is the Percentage of Population Employed in Food Preparation & Serving in Seminole, FL?
Percentage of Population Employed in Food Preparation & Serving in Seminole is 5.9%.
What is the Percentage of Population Employed in Food Preparation & Serving in Florida?
Percentage of Population Employed in Food Preparation & Serving in Florida is 6.1%.
What is the Percentage of Population Employed in Food Preparation & Serving in the United States?
Percentage of Population Employed in Food Preparation & Serving in the United States is 5.3%.