Zip Codes with the Highest Percentage of Population Employed in Food Preparation & Serving in Hialeah, FL
RELATED REPORTS & OPTIONS
Food Preparation & Serving
Hialeah
Compare Zip Codes
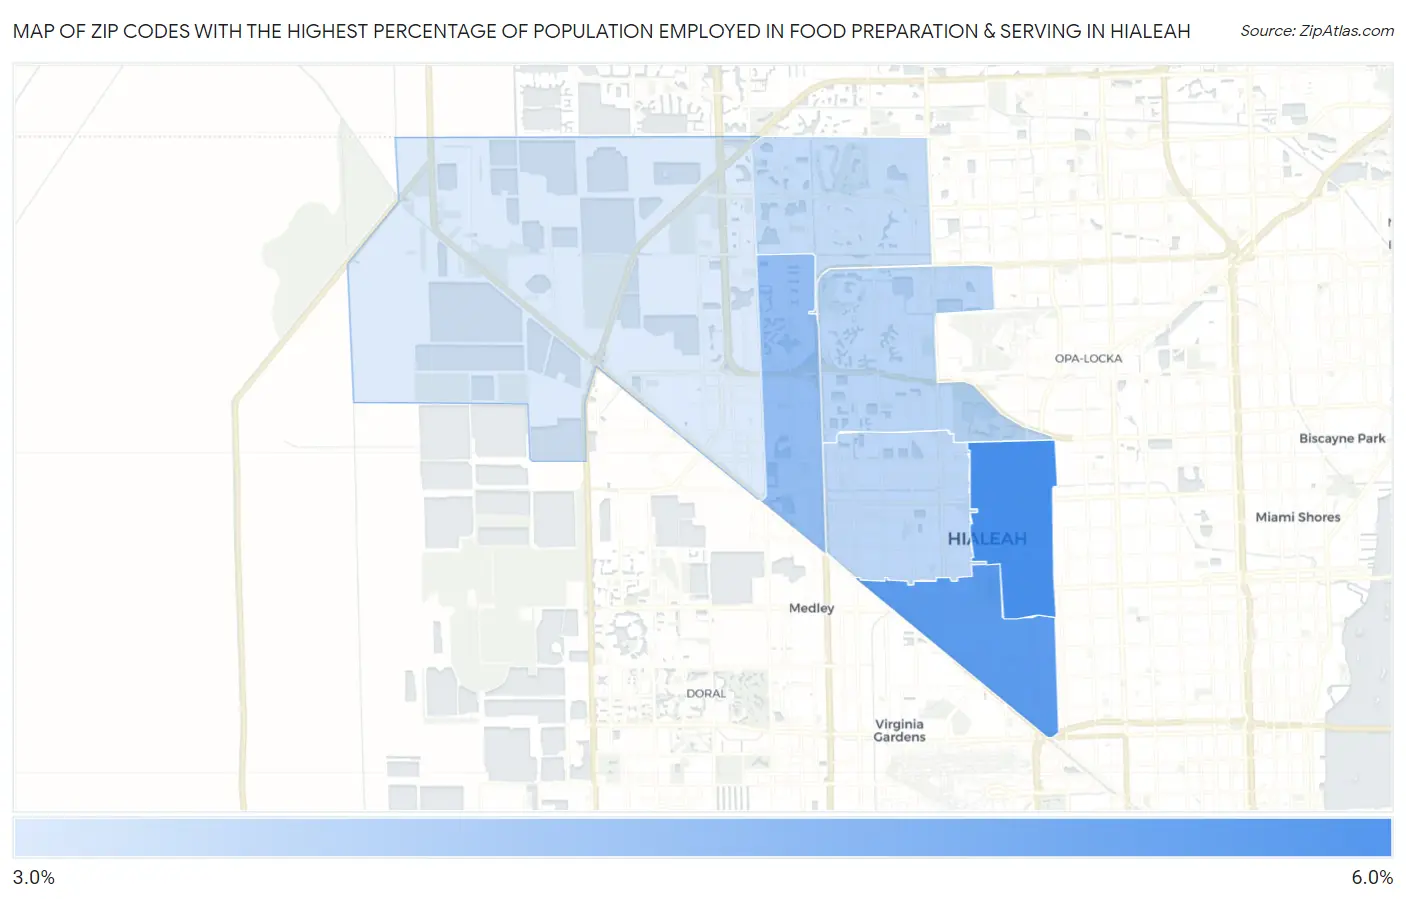
Map of Zip Codes with the Highest Percentage of Population Employed in Food Preparation & Serving in Hialeah
3.4%
6.0%
Zip Codes with the Highest Percentage of Population Employed in Food Preparation & Serving in Hialeah, FL
| Zip Code | % Employed | vs State | vs National | |
| 1. | 33013 | 6.0% | 6.1%(-0.104)#460 | 5.3%(+0.700)#9,391 |
| 2. | 33010 | 5.6% | 6.1%(-0.452)#511 | 5.3%(+0.352)#10,563 |
| 3. | 33016 | 4.6% | 6.1%(-1.45)#649 | 5.3%(-0.647)#14,413 |
| 4. | 33014 | 4.0% | 6.1%(-2.12)#726 | 5.3%(-1.31)#17,221 |
| 5. | 33012 | 4.0% | 6.1%(-2.13)#729 | 5.3%(-1.33)#17,296 |
| 6. | 33015 | 3.8% | 6.1%(-2.26)#749 | 5.3%(-1.46)#17,823 |
| 7. | 33018 | 3.4% | 6.1%(-2.71)#793 | 5.3%(-1.90)#19,677 |
1
Common Questions
What are the Top 5 Zip Codes with the Highest Percentage of Population Employed in Food Preparation & Serving in Hialeah, FL?
Top 5 Zip Codes with the Highest Percentage of Population Employed in Food Preparation & Serving in Hialeah, FL are:
What zip code has the Highest Percentage of Population Employed in Food Preparation & Serving in Hialeah, FL?
33013 has the Highest Percentage of Population Employed in Food Preparation & Serving in Hialeah, FL with 6.0%.
What is the Percentage of Population Employed in Food Preparation & Serving in Hialeah, FL?
Percentage of Population Employed in Food Preparation & Serving in Hialeah is 4.8%.
What is the Percentage of Population Employed in Food Preparation & Serving in Florida?
Percentage of Population Employed in Food Preparation & Serving in Florida is 6.1%.
What is the Percentage of Population Employed in Food Preparation & Serving in the United States?
Percentage of Population Employed in Food Preparation & Serving in the United States is 5.3%.