Zip Codes with the Highest Percentage of Population Employed in Food Preparation & Serving in Bonita Springs, FL
RELATED REPORTS & OPTIONS
Food Preparation & Serving
Bonita Springs
Compare Zip Codes
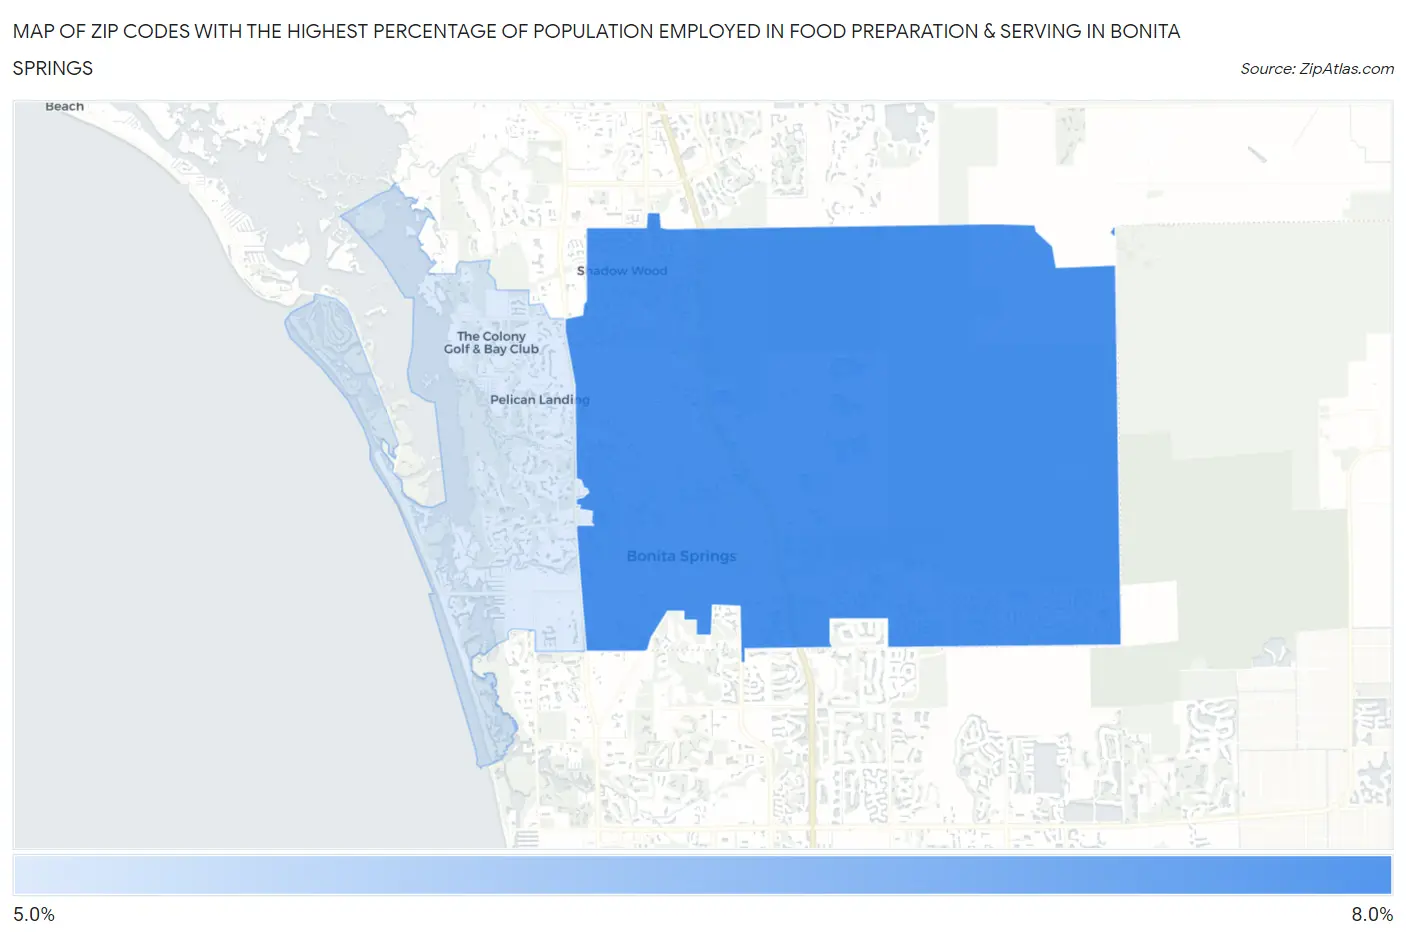
Map of Zip Codes with the Highest Percentage of Population Employed in Food Preparation & Serving in Bonita Springs
5.2%
6.1%
Zip Codes with the Highest Percentage of Population Employed in Food Preparation & Serving in Bonita Springs, FL
| Zip Code | % Employed | vs State | vs National | |
| 1. | 34135 | 6.1% | 6.1%(-0.037)#448 | 5.3%(+0.768)#9,165 |
| 2. | 34134 | 5.2% | 6.1%(-0.858)#562 | 5.3%(-0.053)#12,013 |
1
Common Questions
What are the Top Zip Codes with the Highest Percentage of Population Employed in Food Preparation & Serving in Bonita Springs, FL?
Top Zip Codes with the Highest Percentage of Population Employed in Food Preparation & Serving in Bonita Springs, FL are:
What zip code has the Highest Percentage of Population Employed in Food Preparation & Serving in Bonita Springs, FL?
34135 has the Highest Percentage of Population Employed in Food Preparation & Serving in Bonita Springs, FL with 6.1%.
What is the Percentage of Population Employed in Food Preparation & Serving in Bonita Springs, FL?
Percentage of Population Employed in Food Preparation & Serving in Bonita Springs is 6.2%.
What is the Percentage of Population Employed in Food Preparation & Serving in Florida?
Percentage of Population Employed in Food Preparation & Serving in Florida is 6.1%.
What is the Percentage of Population Employed in Food Preparation & Serving in the United States?
Percentage of Population Employed in Food Preparation & Serving in the United States is 5.3%.