Zip Codes with the Highest Percentage of Population Employed in Food Preparation & Serving in Okeechobee, FL
RELATED REPORTS & OPTIONS
Food Preparation & Serving
Okeechobee
Compare Zip Codes
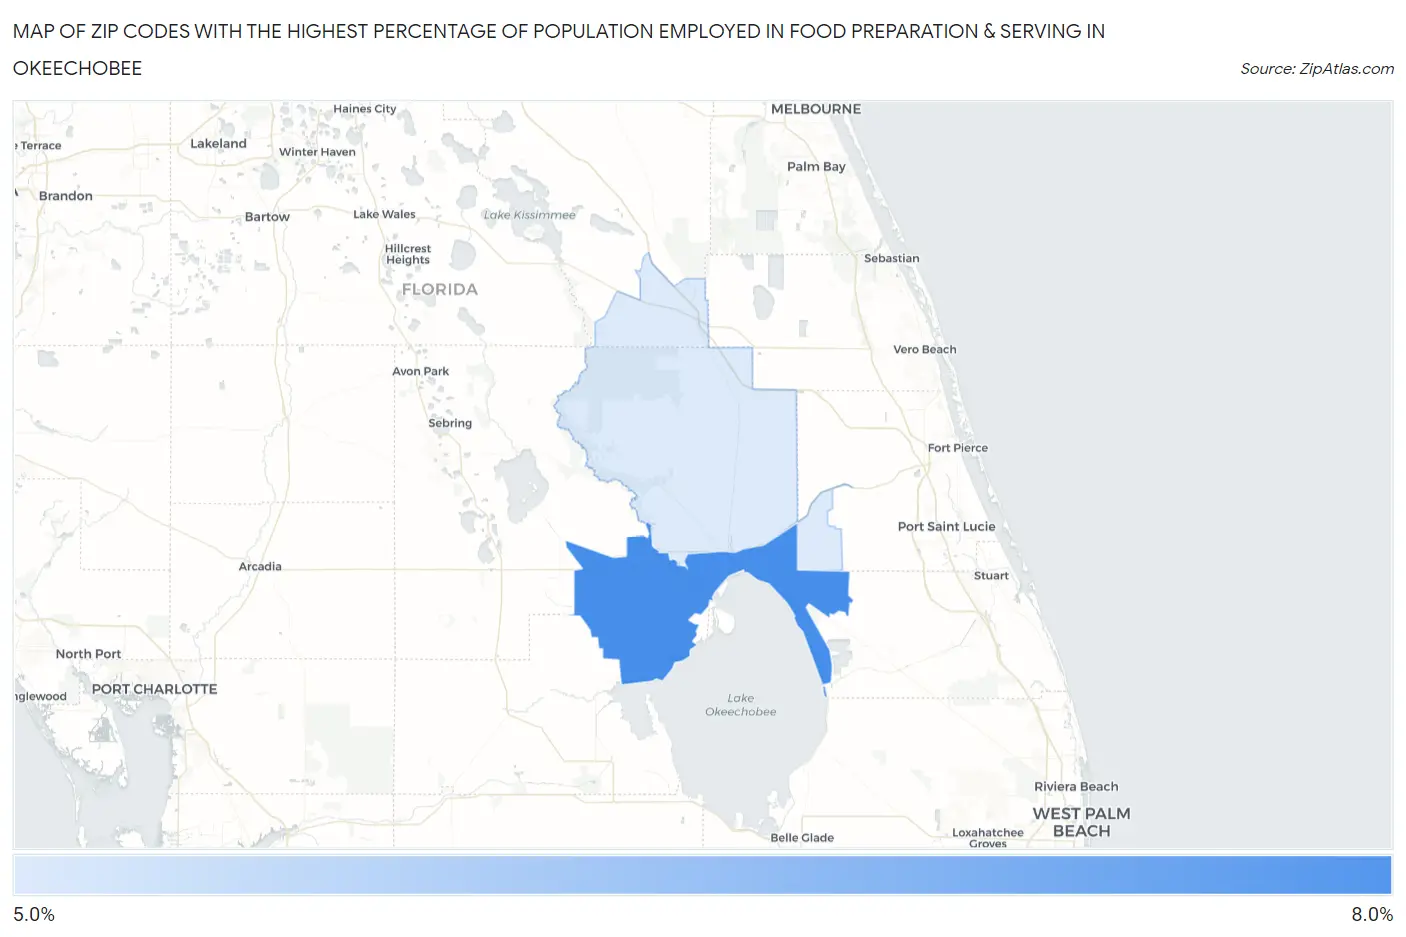
Map of Zip Codes with the Highest Percentage of Population Employed in Food Preparation & Serving in Okeechobee
5.9%
6.3%
Zip Codes with the Highest Percentage of Population Employed in Food Preparation & Serving in Okeechobee, FL
| Zip Code | % Employed | vs State | vs National | |
| 1. | 34974 | 6.3% | 6.1%(+0.204)#411 | 5.3%(+1.01)#8,453 |
| 2. | 34972 | 5.9% | 6.1%(-0.146)#468 | 5.3%(+0.658)#9,526 |
1
Common Questions
What are the Top Zip Codes with the Highest Percentage of Population Employed in Food Preparation & Serving in Okeechobee, FL?
Top Zip Codes with the Highest Percentage of Population Employed in Food Preparation & Serving in Okeechobee, FL are:
What zip code has the Highest Percentage of Population Employed in Food Preparation & Serving in Okeechobee, FL?
34974 has the Highest Percentage of Population Employed in Food Preparation & Serving in Okeechobee, FL with 6.3%.
What is the Percentage of Population Employed in Food Preparation & Serving in Okeechobee, FL?
Percentage of Population Employed in Food Preparation & Serving in Okeechobee is 6.2%.
What is the Percentage of Population Employed in Food Preparation & Serving in Florida?
Percentage of Population Employed in Food Preparation & Serving in Florida is 6.1%.
What is the Percentage of Population Employed in Food Preparation & Serving in the United States?
Percentage of Population Employed in Food Preparation & Serving in the United States is 5.3%.