Zip Codes with the Highest Percentage of Population Employed in Food Preparation & Serving in North Fort Myers, FL
RELATED REPORTS & OPTIONS
Food Preparation & Serving
North Fort Myers
Compare Zip Codes
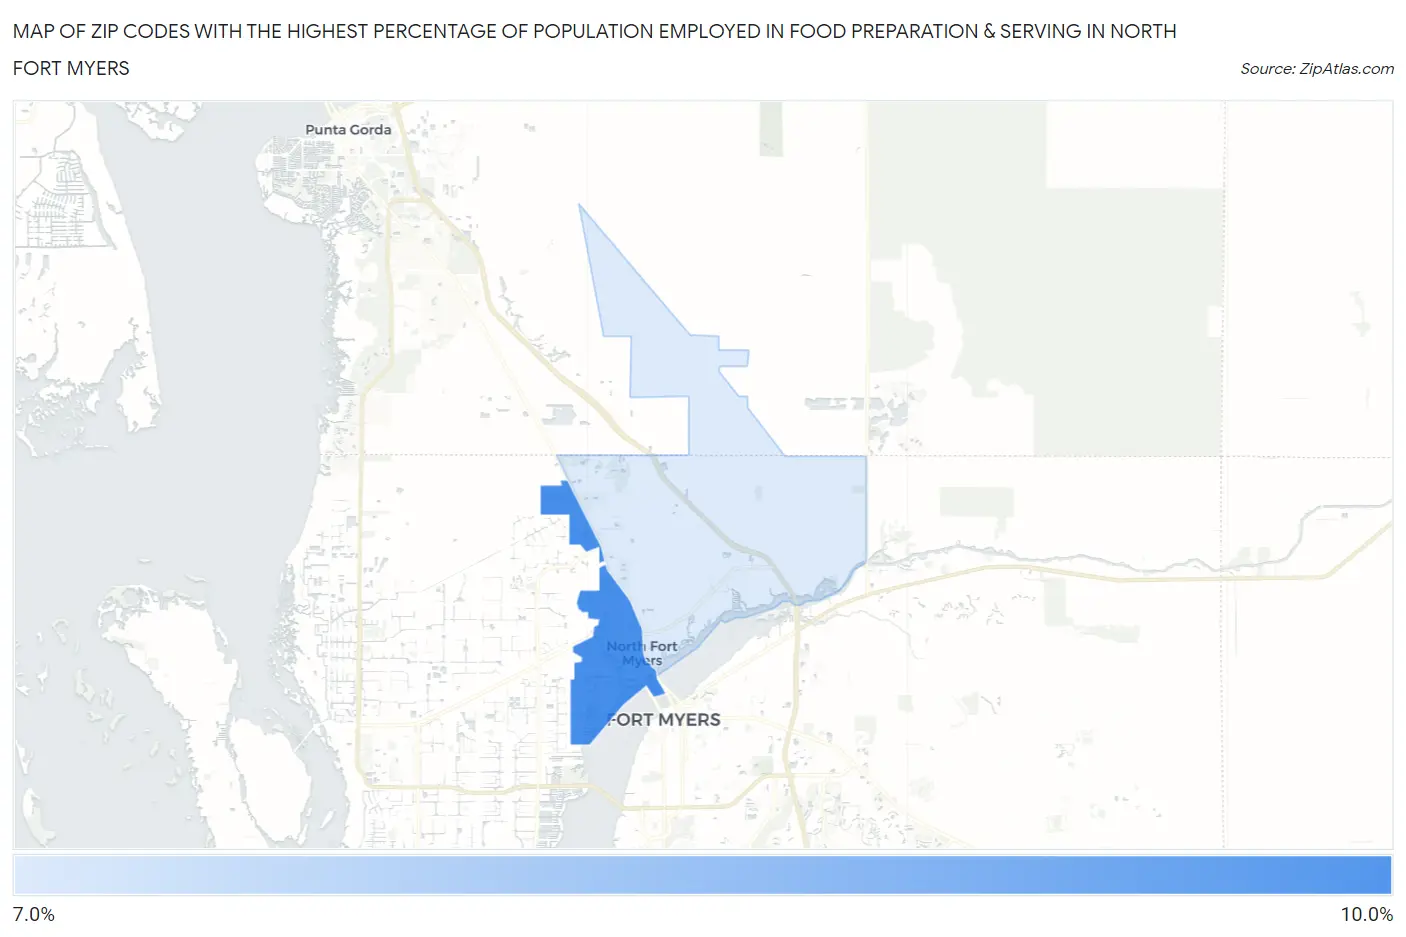
Map of Zip Codes with the Highest Percentage of Population Employed in Food Preparation & Serving in North Fort Myers
7.9%
8.4%
Zip Codes with the Highest Percentage of Population Employed in Food Preparation & Serving in North Fort Myers, FL
| Zip Code | % Employed | vs State | vs National | |
| 1. | 33903 | 8.4% | 6.1%(+2.34)#164 | 5.3%(+3.14)#4,138 |
| 2. | 33917 | 7.9% | 6.1%(+1.77)#207 | 5.3%(+2.57)#4,952 |
1
Common Questions
What are the Top Zip Codes with the Highest Percentage of Population Employed in Food Preparation & Serving in North Fort Myers, FL?
Top Zip Codes with the Highest Percentage of Population Employed in Food Preparation & Serving in North Fort Myers, FL are:
What zip code has the Highest Percentage of Population Employed in Food Preparation & Serving in North Fort Myers, FL?
33903 has the Highest Percentage of Population Employed in Food Preparation & Serving in North Fort Myers, FL with 8.4%.
What is the Percentage of Population Employed in Food Preparation & Serving in North Fort Myers, FL?
Percentage of Population Employed in Food Preparation & Serving in North Fort Myers is 8.3%.
What is the Percentage of Population Employed in Food Preparation & Serving in Florida?
Percentage of Population Employed in Food Preparation & Serving in Florida is 6.1%.
What is the Percentage of Population Employed in Food Preparation & Serving in the United States?
Percentage of Population Employed in Food Preparation & Serving in the United States is 5.3%.