Zip Codes with the Highest Percentage of Population Employed in Food Preparation & Serving in Coral Springs, FL
RELATED REPORTS & OPTIONS
Food Preparation & Serving
Coral Springs
Compare Zip Codes
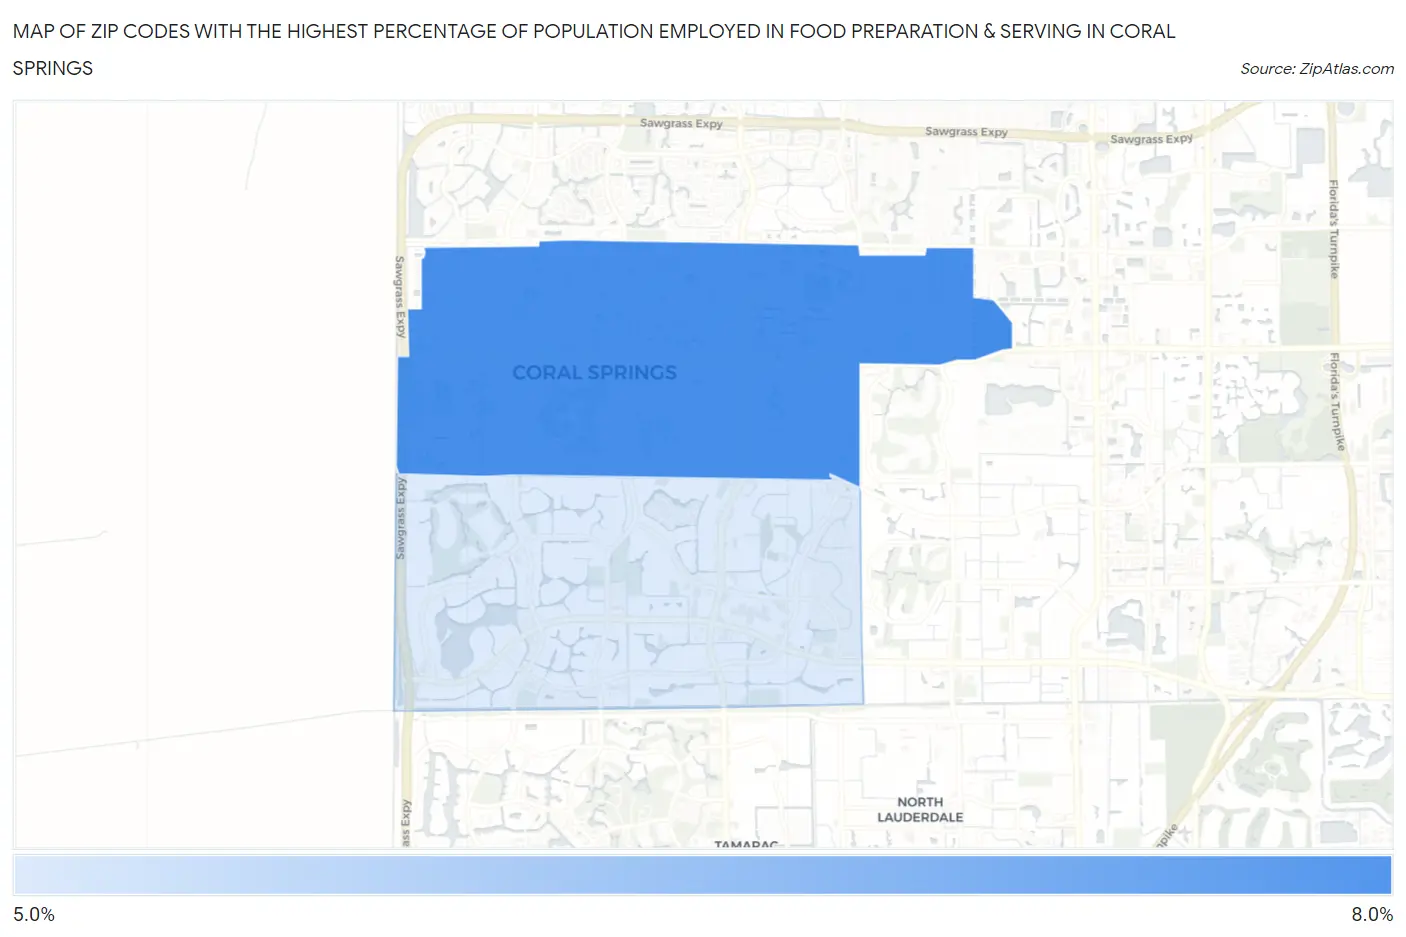
Map of Zip Codes with the Highest Percentage of Population Employed in Food Preparation & Serving in Coral Springs
5.7%
6.3%
Zip Codes with the Highest Percentage of Population Employed in Food Preparation & Serving in Coral Springs, FL
| Zip Code | % Employed | vs State | vs National | |
| 1. | 33065 | 6.3% | 6.1%(+0.168)#417 | 5.3%(+0.973)#8,551 |
| 2. | 33071 | 5.7% | 6.1%(-0.350)#498 | 5.3%(+0.455)#10,202 |
1
Common Questions
What are the Top Zip Codes with the Highest Percentage of Population Employed in Food Preparation & Serving in Coral Springs, FL?
Top Zip Codes with the Highest Percentage of Population Employed in Food Preparation & Serving in Coral Springs, FL are:
What zip code has the Highest Percentage of Population Employed in Food Preparation & Serving in Coral Springs, FL?
33065 has the Highest Percentage of Population Employed in Food Preparation & Serving in Coral Springs, FL with 6.3%.
What is the Percentage of Population Employed in Food Preparation & Serving in Coral Springs, FL?
Percentage of Population Employed in Food Preparation & Serving in Coral Springs is 5.7%.
What is the Percentage of Population Employed in Food Preparation & Serving in Florida?
Percentage of Population Employed in Food Preparation & Serving in Florida is 6.1%.
What is the Percentage of Population Employed in Food Preparation & Serving in the United States?
Percentage of Population Employed in Food Preparation & Serving in the United States is 5.3%.