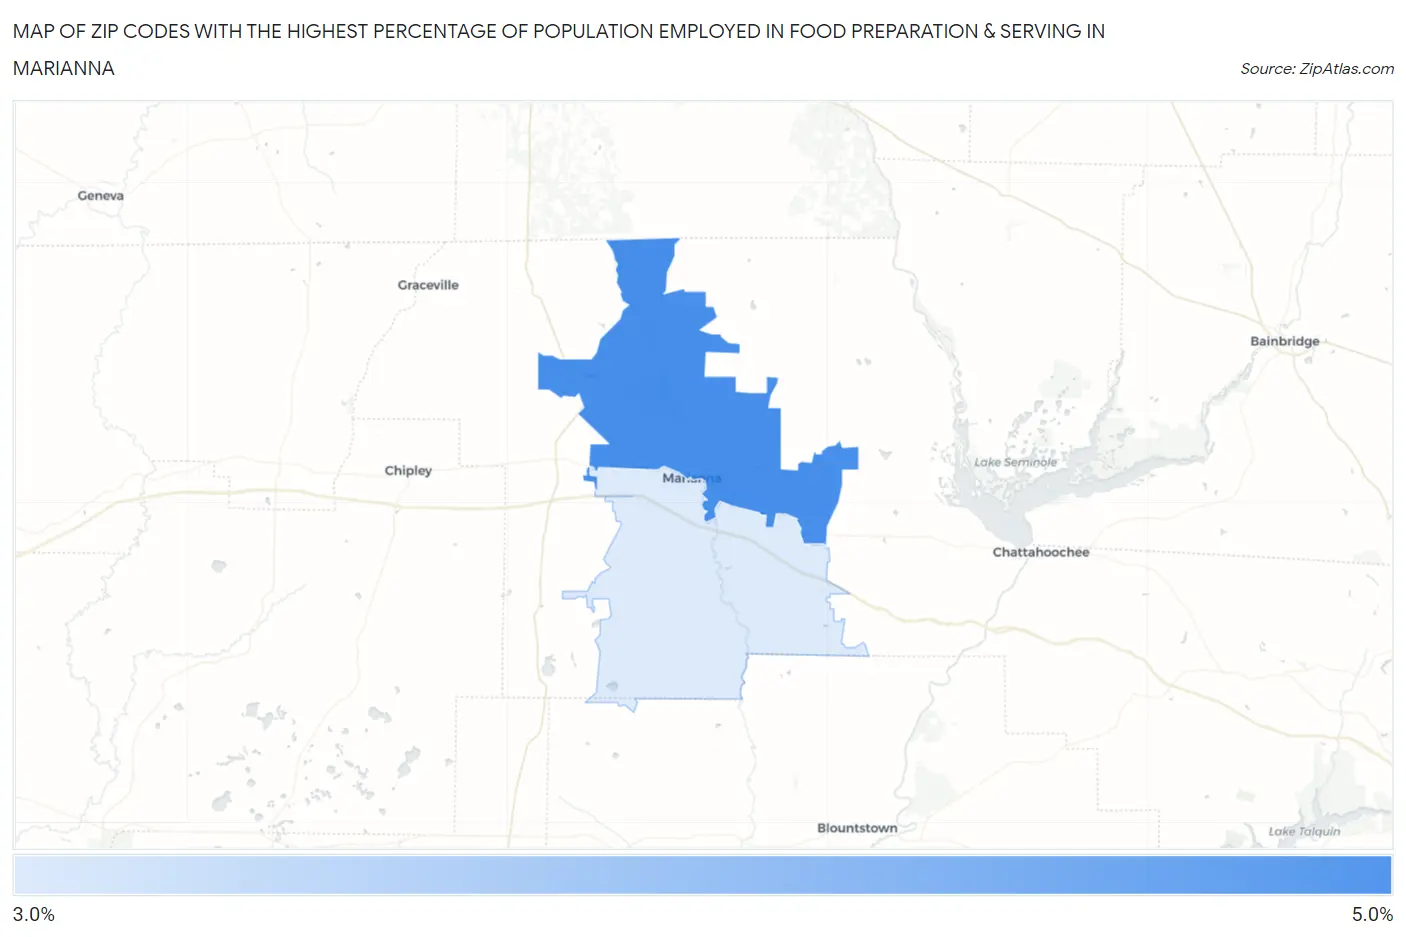
Zip Codes with the Highest Percentage of Population Employed in Food Preparation & Serving in Marianna, FL
RELATED REPORTS & OPTIONS
Food Preparation & Serving
Marianna
Compare Zip Codes
Map of Zip Codes with the Highest Percentage of Population Employed in Food Preparation & Serving in Marianna
3.5%
4.2%
Zip Codes with the Highest Percentage of Population Employed in Food Preparation & Serving in Marianna, FL
| Zip Code | % Employed | vs State | vs National | |
| 1. | 32446 | 4.2% | 6.1%(-1.88)#695 | 5.3%(-1.08)#16,291 |
| 2. | 32448 | 3.5% | 6.1%(-2.59)#782 | 5.3%(-1.78)#19,196 |
1
Common Questions
What are the Top Zip Codes with the Highest Percentage of Population Employed in Food Preparation & Serving in Marianna, FL?
Top Zip Codes with the Highest Percentage of Population Employed in Food Preparation & Serving in Marianna, FL are:
What zip code has the Highest Percentage of Population Employed in Food Preparation & Serving in Marianna, FL?
32446 has the Highest Percentage of Population Employed in Food Preparation & Serving in Marianna, FL with 4.2%.
What is the Percentage of Population Employed in Food Preparation & Serving in Marianna, FL?
Percentage of Population Employed in Food Preparation & Serving in Marianna is 2.6%.
What is the Percentage of Population Employed in Food Preparation & Serving in Florida?
Percentage of Population Employed in Food Preparation & Serving in Florida is 6.1%.
What is the Percentage of Population Employed in Food Preparation & Serving in the United States?
Percentage of Population Employed in Food Preparation & Serving in the United States is 5.3%.