Zip Codes with the Highest Percentage of Population Employed in Installation, Maintenance & Repair in Jacksonville, FL
RELATED REPORTS & OPTIONS
Installation, Maintenance & Repair
Jacksonville
Compare Zip Codes
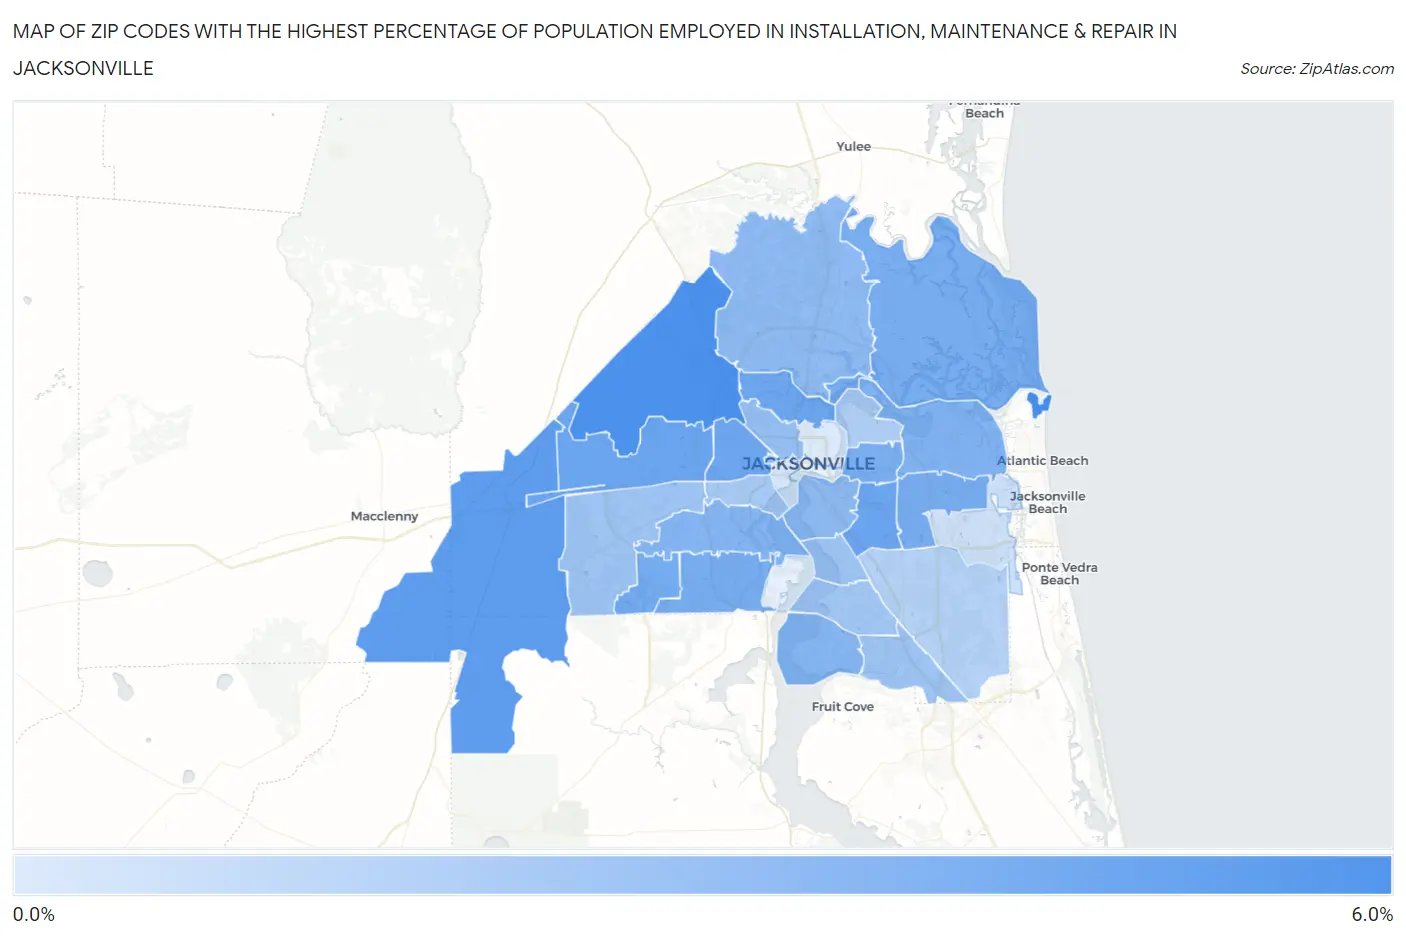
Map of Zip Codes with the Highest Percentage of Population Employed in Installation, Maintenance & Repair in Jacksonville
1.1%
5.8%
Zip Codes with the Highest Percentage of Population Employed in Installation, Maintenance & Repair in Jacksonville, FL
| Zip Code | % Employed | vs State | vs National | |
| 1. | 32227 | 5.8% | 3.3%(+2.56)#107 | 3.1%(+2.77)#6,467 |
| 2. | 32219 | 5.7% | 3.3%(+2.42)#111 | 3.1%(+2.64)#6,758 |
| 3. | 32234 | 5.1% | 3.3%(+1.77)#165 | 3.1%(+1.99)#8,555 |
| 4. | 32220 | 4.7% | 3.3%(+1.38)#203 | 3.1%(+1.60)#9,793 |
| 5. | 32216 | 4.6% | 3.3%(+1.33)#209 | 3.1%(+1.55)#9,993 |
| 6. | 32208 | 4.6% | 3.3%(+1.29)#218 | 3.1%(+1.51)#10,118 |
| 7. | 32254 | 4.5% | 3.3%(+1.24)#229 | 3.1%(+1.46)#10,315 |
| 8. | 32222 | 4.3% | 3.3%(+1.03)#265 | 3.1%(+1.25)#11,085 |
| 9. | 32246 | 4.3% | 3.3%(+1.01)#271 | 3.1%(+1.23)#11,180 |
| 10. | 32244 | 4.3% | 3.3%(+0.985)#274 | 3.1%(+1.20)#11,256 |
| 11. | 32226 | 4.3% | 3.3%(+0.985)#275 | 3.1%(+1.20)#11,257 |
| 12. | 32211 | 4.1% | 3.3%(+0.822)#295 | 3.1%(+1.04)#11,882 |
| 13. | 32225 | 4.0% | 3.3%(+0.665)#319 | 3.1%(+0.883)#12,584 |
| 14. | 32210 | 3.8% | 3.3%(+0.563)#337 | 3.1%(+0.782)#13,034 |
| 15. | 32223 | 3.8% | 3.3%(+0.486)#357 | 3.1%(+0.704)#13,368 |
| 16. | 32218 | 3.6% | 3.3%(+0.269)#398 | 3.1%(+0.487)#14,357 |
| 17. | 32207 | 3.5% | 3.3%(+0.248)#405 | 3.1%(+0.467)#14,466 |
| 18. | 32209 | 3.3% | 3.3%(+0.038)#449 | 3.1%(+0.256)#15,441 |
| 19. | 32217 | 3.0% | 3.3%(-0.240)#505 | 3.1%(-0.022)#16,773 |
| 20. | 32258 | 3.0% | 3.3%(-0.292)#515 | 3.1%(-0.074)#17,010 |
| 21. | 32221 | 3.0% | 3.3%(-0.298)#516 | 3.1%(-0.079)#17,037 |
| 22. | 32257 | 2.9% | 3.3%(-0.391)#534 | 3.1%(-0.173)#17,521 |
| 23. | 32205 | 2.7% | 3.3%(-0.597)#568 | 3.1%(-0.378)#18,605 |
| 24. | 32277 | 2.4% | 3.3%(-0.850)#620 | 3.1%(-0.632)#19,885 |
| 25. | 32256 | 2.3% | 3.3%(-1.00)#658 | 3.1%(-0.783)#20,648 |
| 26. | 32224 | 1.5% | 3.3%(-1.77)#803 | 3.1%(-1.55)#24,090 |
| 27. | 32204 | 1.3% | 3.3%(-2.02)#832 | 3.1%(-1.80)#24,988 |
| 28. | 32206 | 1.1% | 3.3%(-2.24)#859 | 3.1%(-2.02)#25,769 |
1
Common Questions
What are the Top 10 Zip Codes with the Highest Percentage of Population Employed in Installation, Maintenance & Repair in Jacksonville, FL?
Top 10 Zip Codes with the Highest Percentage of Population Employed in Installation, Maintenance & Repair in Jacksonville, FL are:
What zip code has the Highest Percentage of Population Employed in Installation, Maintenance & Repair in Jacksonville, FL?
32227 has the Highest Percentage of Population Employed in Installation, Maintenance & Repair in Jacksonville, FL with 5.8%.
What is the Percentage of Population Employed in Installation, Maintenance & Repair in Jacksonville, FL?
Percentage of Population Employed in Installation, Maintenance & Repair in Jacksonville is 3.5%.
What is the Percentage of Population Employed in Installation, Maintenance & Repair in Florida?
Percentage of Population Employed in Installation, Maintenance & Repair in Florida is 3.3%.
What is the Percentage of Population Employed in Installation, Maintenance & Repair in the United States?
Percentage of Population Employed in Installation, Maintenance & Repair in the United States is 3.1%.