Zip Codes with the Highest Percentage of Population Employed in Food Preparation & Serving in Ormond Beach, FL
RELATED REPORTS & OPTIONS
Food Preparation & Serving
Ormond Beach
Compare Zip Codes
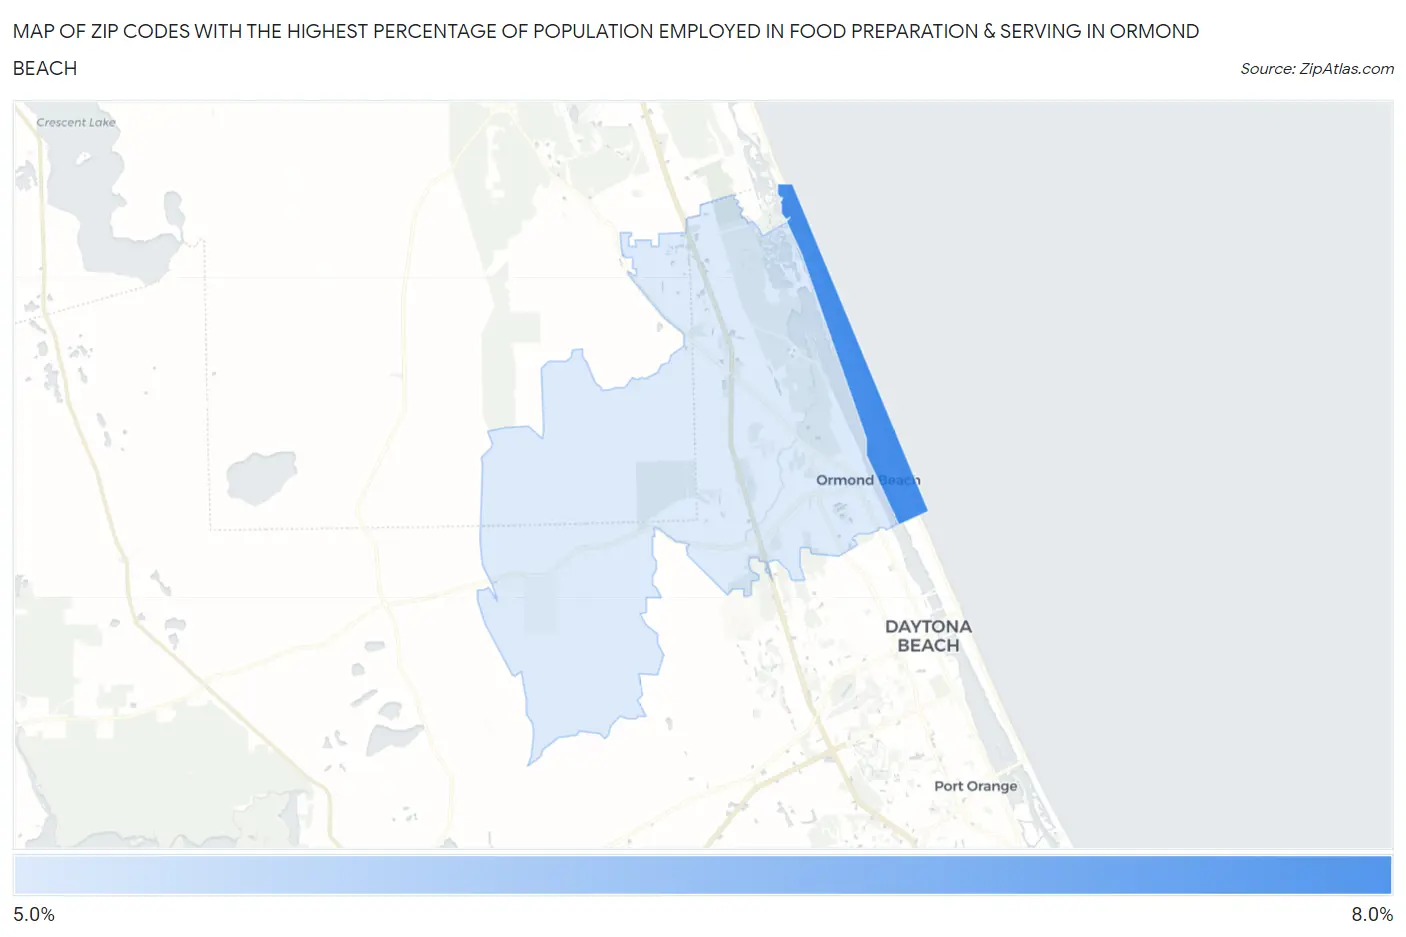
Map of Zip Codes with the Highest Percentage of Population Employed in Food Preparation & Serving in Ormond Beach
5.5%
6.2%
Zip Codes with the Highest Percentage of Population Employed in Food Preparation & Serving in Ormond Beach, FL
| Zip Code | % Employed | vs State | vs National | |
| 1. | 32176 | 6.2% | 6.1%(+0.085)#428 | 5.3%(+0.890)#8,806 |
| 2. | 32174 | 5.5% | 6.1%(-0.567)#529 | 5.3%(+0.238)#10,985 |
1
Common Questions
What are the Top Zip Codes with the Highest Percentage of Population Employed in Food Preparation & Serving in Ormond Beach, FL?
Top Zip Codes with the Highest Percentage of Population Employed in Food Preparation & Serving in Ormond Beach, FL are:
What zip code has the Highest Percentage of Population Employed in Food Preparation & Serving in Ormond Beach, FL?
32176 has the Highest Percentage of Population Employed in Food Preparation & Serving in Ormond Beach, FL with 6.2%.
What is the Percentage of Population Employed in Food Preparation & Serving in Ormond Beach, FL?
Percentage of Population Employed in Food Preparation & Serving in Ormond Beach is 6.1%.
What is the Percentage of Population Employed in Food Preparation & Serving in Florida?
Percentage of Population Employed in Food Preparation & Serving in Florida is 6.1%.
What is the Percentage of Population Employed in Food Preparation & Serving in the United States?
Percentage of Population Employed in Food Preparation & Serving in the United States is 5.3%.